

AUD/JPY Price Forecast: Recovers early losses sharply
- AUD/JPY recovers most of its initial losses while the market sentiment remains risk-averse.
- Israel launched a series of attacks on military bases and nuclear facilities of Iran.
- Next week, the BoJ is expected to keep interest rates steady at 0.5%.
The AUD/JPY pair claws back a majority of early losses and rebounds from the intraday low of 92.32 during European trading hours on Friday. Still, the pair is down 0.5% to near 93.30. The cross faced a sharp selling pressure earlier in the day as tensions in the Middle East have diminished demand for risk-perceived assets, such as the Australian Dollar (AUD).
Australian Dollar PRICE Today
The table below shows the percentage change of Australian Dollar (AUD) against listed major currencies today. Australian Dollar was the weakest against the US Dollar.
| USD | EUR | GBP | JPY | CAD | AUD | NZD | CHF | |
|---|---|---|---|---|---|---|---|---|
| USD | 0.69% | 0.54% | 0.61% | 0.24% | 0.98% | 1.18% | 0.44% | |
| EUR | -0.69% | -0.11% | -0.03% | -0.38% | 0.37% | 0.46% | -0.25% | |
| GBP | -0.54% | 0.11% | 0.04% | -0.35% | 0.40% | 0.56% | -0.12% | |
| JPY | -0.61% | 0.03% | -0.04% | -0.34% | 0.38% | 0.55% | -0.15% | |
| CAD | -0.24% | 0.38% | 0.35% | 0.34% | 0.72% | 0.95% | 0.23% | |
| AUD | -0.98% | -0.37% | -0.40% | -0.38% | -0.72% | 0.17% | -0.52% | |
| NZD | -1.18% | -0.46% | -0.56% | -0.55% | -0.95% | -0.17% | -0.69% | |
| CHF | -0.44% | 0.25% | 0.12% | 0.15% | -0.23% | 0.52% | 0.69% |
The heat map shows percentage changes of major currencies against each other. The base currency is picked from the left column, while the quote currency is picked from the top row. For example, if you pick the Australian Dollar from the left column and move along the horizontal line to the US Dollar, the percentage change displayed in the box will represent AUD (base)/USD (quote).
Early Friday, Israel struck a number of military and nuclear facilities in Iran, aiming to restrict them from building nuclear warheads. In retaliation, Tehran has launched about 100 drones towards Israel, BBC reported.
During the European session, United States (US) President Donald Trump has urged Iran to make a deal before it gets too late through a post on Truth.Social.
Meanwhile, the demand for the Japanese Yen (JPY) as a safe-haven asset has increased.
Going forward, investors will focus on the Bank of Japan’s (BoJ) monetary policy on Tuesday, in which the central bank is expected to hold interest rates steady at 0.5%.
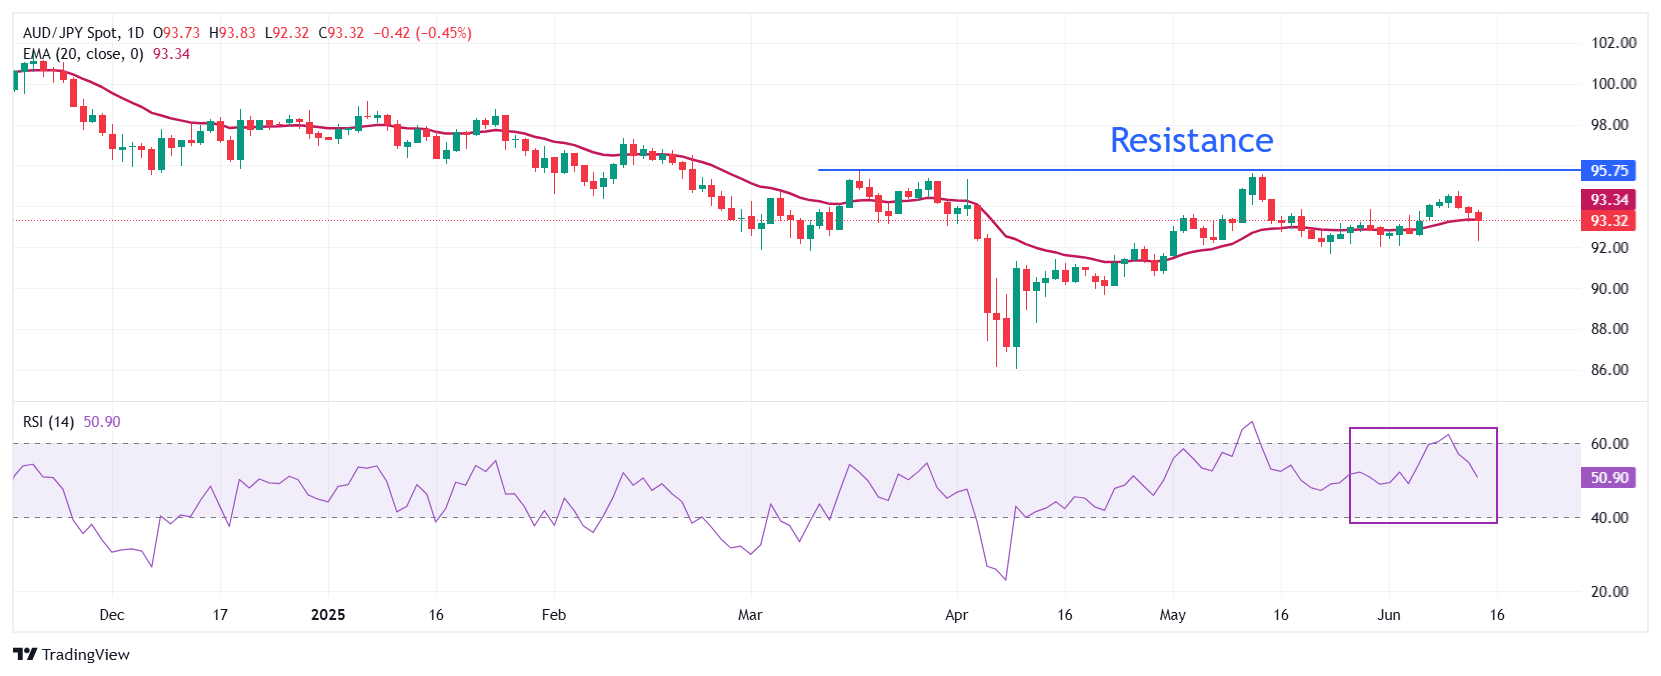
AUD/JPY exhibits a volatile performance near the 20-day Exponential Moving Average (EMA), which is around 93.33, suggesting that the near-term trend is uncertain.
The 14-day Relative Strength Index (RSI) falls after failing to hold above 60.00, indicating that the upside is capped.
The pair could revisit the March 18 high of 95.70 and extend its upside beyond that towards the February 19 high of 96.77 if it manages to break above the May 15 high of 94.37.
In an alternate scenario, a downside move by the pair below the May 23 low of 91.65 could expose it to the April 29 low of 90.60, followed by the psychological level of 90.00.
AUD/JPY daily chart
Economic Indicator
BoJ Interest Rate Decision
The Bank of Japan (BoJ) announces its interest rate decision after each of the Bank’s eight scheduled annual meetings. Generally, if the BoJ is hawkish about the inflationary outlook of the economy and raises interest rates it is bullish for the Japanese Yen (JPY). Likewise, if the BoJ has a dovish view on the Japanese economy and keeps interest rates unchanged, or cuts them, it is usually bearish for JPY.
Read more.Next release: Tue Jun 17, 2025 03:00
Frequency: Irregular
Consensus: -
Previous: 0.5%
Source: Bank of Japan
Recommended Articles


