AUD/JPY Price Analysis: Bullish momentum signaled through short-term consolidation is on the horizon

Source Fxstreet
  • Building momentum is indicated by the RSI on the daily chart.
  • The hourly chart also strengthens the positive outlook, with the presence of bullish momentum but hinting at a slight wobble.
  • The pair recovered the 20-day SMA affirming the continued bullish sentiment.

During Wednesday's session, the AUD/JPY edged higher. The strength of the buyers primarily on the daily chart fuels this bullish sentiment. However, the hourly chart flashes signs of short-term contention, suggesting a potential consolidation for the rest of the session.

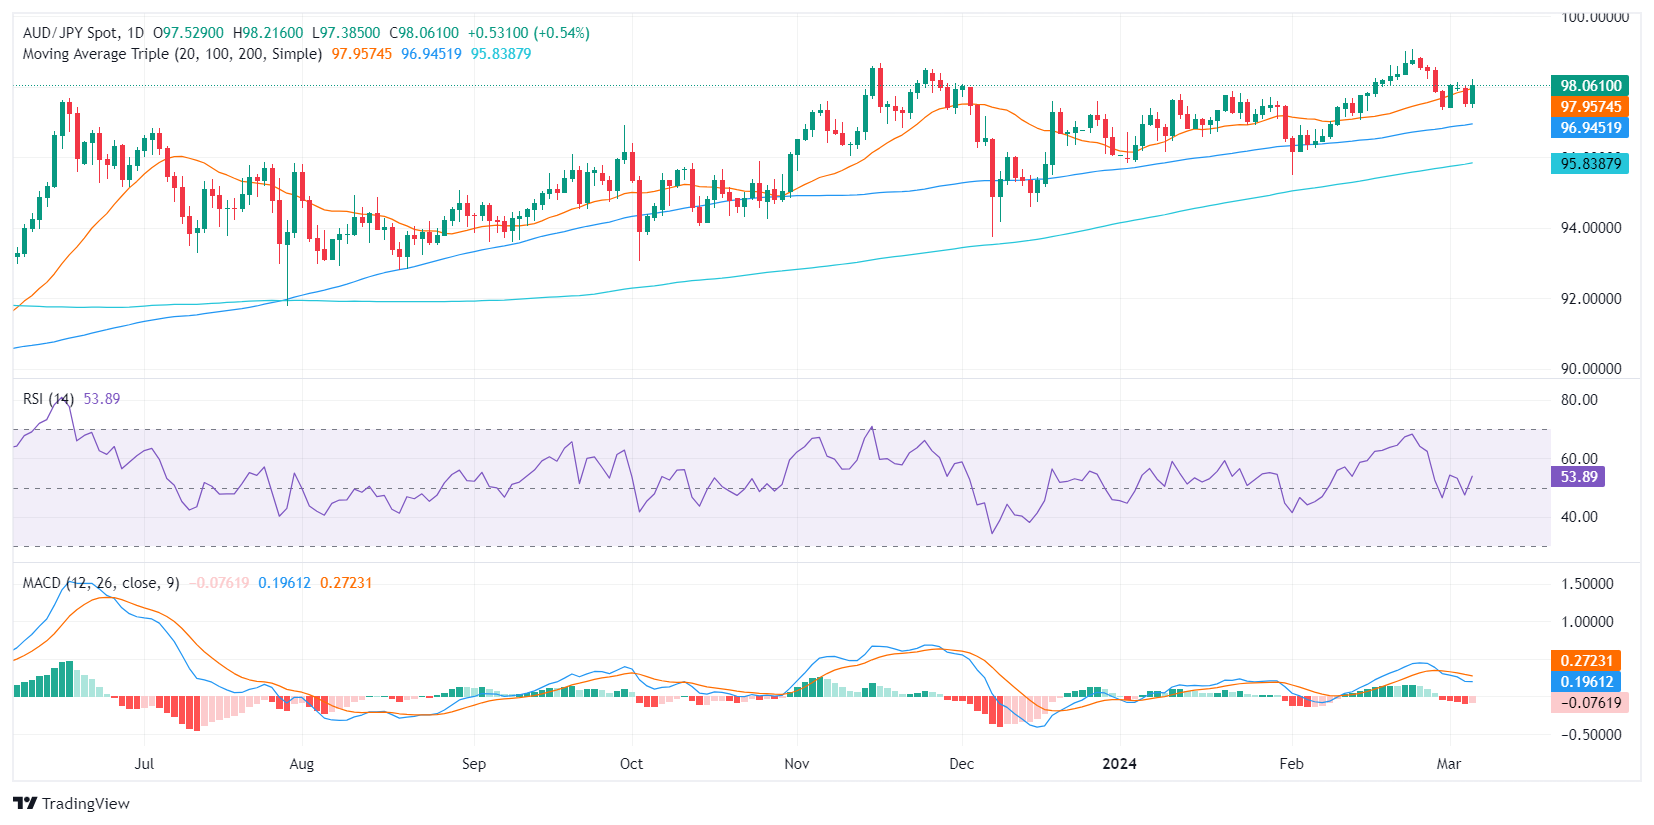
On the daily chart, the AUD/JPY pair indicates some bullish momentum. The Relative Strength Index (RSI) has moved into positive territory, which marks an upbeat momentum, with its latest reading standing slightly above the midpoint. Simultaneously, the Moving Average Convergence Divergence (MACD) histogram printing flat red bars indicates a decreasing bearish momentum in the short term.

AUD/JPY daily chart
Switching to the hourly chart, the RSI is treading in the positive region, confirming the bullish daily scenario. However, the index seems to be consolidating after nearing overbought conditions earlier in the session. In addition, the MACD histogram reveals decreasing green bars, suggesting the bullish momentum is waning on the hourly chart.

AUD/JPY hourly chart
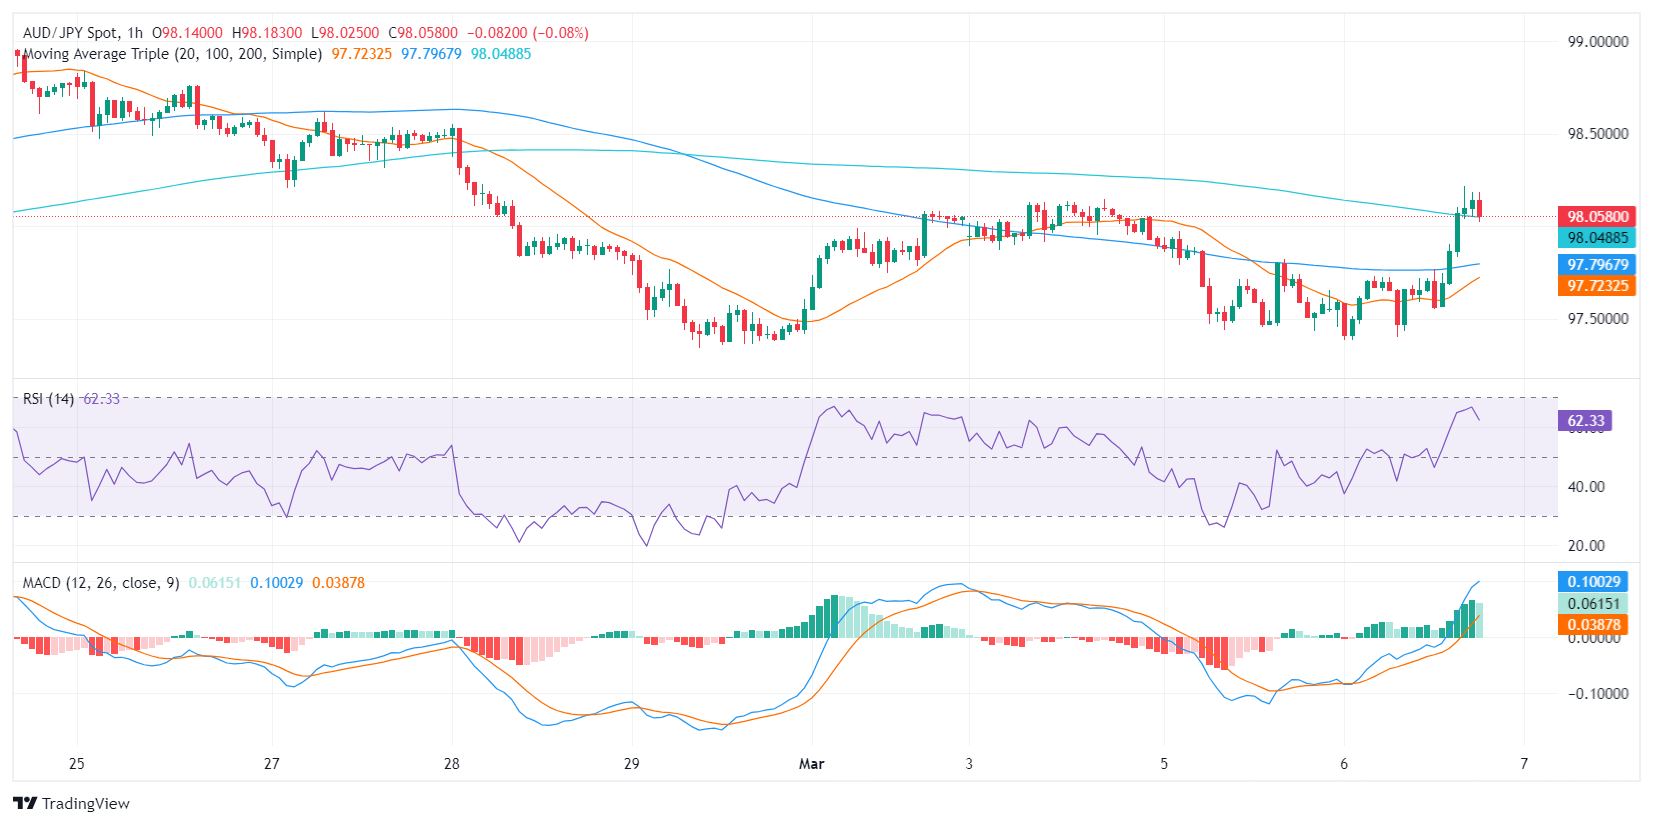
In conclusion, both the daily and hourly charts suggest a bullish momentum, notwithstanding the short-term signs of a pullback. Given the pair's position being above the 20,100,200-day SMAs, the overall trend remains in favor of the buyers, unless a significant shift in momentum is seen.


Disclaimer: For information purposes only. Past performance is not indicative of future results.
placeholder
What Crypto Whales are Buying For May 2025Crypto whales are making bold moves heading into May 2025, and three tokens are standing out: Ethereum (ETH), Artificial Superintelligence Alliance (FET), and Onyxcoin (XCN).
Author  Beincrypto
Apr 21, Mon
Crypto whales are making bold moves heading into May 2025, and three tokens are standing out: Ethereum (ETH), Artificial Superintelligence Alliance (FET), and Onyxcoin (XCN).
placeholder
Bitcoin ETF Inflows For 2025 Now Outpace 2024, Data ShowsUS Bitcoin spot exchange-traded funds (ETFs) have seen more inflows this year so far compared to the same point in 2024, according to data.
Author  Bitcoinist
Jul 16, Wed
US Bitcoin spot exchange-traded funds (ETFs) have seen more inflows this year so far compared to the same point in 2024, according to data.
placeholder
Litecoin Price Forecast: LTC breaks above bullish technical pattern, targets $170 markLitecoin (LTC) price is showing renewed bullish strength after breaking out of an ascending channel pattern, trading above $133 at the time of writing on Wednesday.
Author  FXStreet
Aug 13, Wed
Litecoin (LTC) price is showing renewed bullish strength after breaking out of an ascending channel pattern, trading above $133 at the time of writing on Wednesday.
placeholder
Gold Price Forecast: XAU/USD gains momentum to near $3,650, eyes on US CPI releaseThe Gold price (XAU/USD) gains momentum to near $3,645 during the early Asian session on Thursday.
Author  FXStreet
Sep 11, Thu
The Gold price (XAU/USD) gains momentum to near $3,645 during the early Asian session on Thursday.
placeholder
Silver Price Forecast: XAG/USD rises to near $48.50 as Fed rate cut bets increaseSilver price (XAG/USD) gains ground after recovering losses registered in the previous session, trading around $48.40 per troy ounce during the Asian hours on Friday.
Author  FXStreet
Yesterday 06: 03
Silver price (XAG/USD) gains ground after recovering losses registered in the previous session, trading around $48.40 per troy ounce during the Asian hours on Friday.
Related Instrument
goTop
quote