
AUD/USD eyes breakout above 0.6500 amid weak US Dollar
- The Australian Dollar hits a fresh weekly high near 0.6480, up over 1.20% on the day.
- The 0.6500 psychological level and descending trendline continue to act as key resistance.
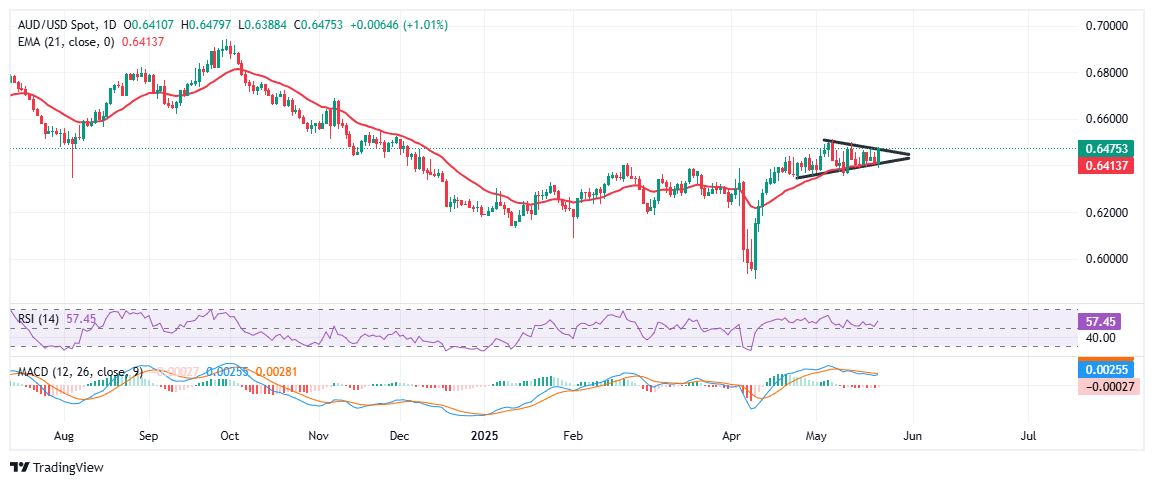
- AUD/USD holds firmly above the 21-day EMA at 0.6414, reinforcing short-term bullish bias.
The Australian Dollar (AUD) pushes higher against the US Dollar (USD), reaching a fresh weekly high near 0.6480 on Friday, up more than 1.20% on the day. The AUD/USD pair is gaining ground amid broad-based US Dollar weakness and resilient risk sentiment, but despite the bullish tone, the pair remains trapped within a tight range. The upside faces strong resistance from a descending trendline and the 0.6500 psychological barrier, a level that has repeatedly capped gains this month.
At the same time, the Aussie is drawing additional strength from encouraging signals on the global trade front. China’s Foreign Ministry confirmed that Beijing and Washington have agreed to maintain open communication channels following a high-level diplomatic exchange.
From a technical standpoint, price action over the past few weeks has taken the shape of a bullish pennant, a technical chart pattern that often signals continuation after a strong upside move. This pattern comes on the back of the pair’s sharp rebound from April’s low near the 0.5900 psychological mark. The choppy price action in recent days suggests that bulls are cautious before placing fresh bets.
The buyers have managed to keep the pair above the 0.6400 round figure, a former resistance turned support, which closely coincides with the 21-day Exponential Moving Average (EMA) at 0.6414. AUD/USD has consistently held above this key support throughout May, indicating buyers are still in control. The price has been tightening within converging trendlines, and a breakout above the upper boundary of the pennant around the 0.6480–0.6500 region could be the catalyst for a move toward the 0.6550 level not seen since November 2024.
Strengthening the case for further gains, Momentum indicators add further weight to the bullish setup. The Relative Strength Index (RSI) is holding firm above the neutral 50 level, currently at 57.3, suggesting that bullish momentum is building but still has room to reach the overbought territory. Meanwhile, the Moving Average Convergence Divergence (MACD) is also leaning in favor of further gains. The MACD line has crossed above the signal line, and the histogram is positive, both classic signs of rising upward pressure.
Overall, as long as the pair remains supported above the 21-day EMA and the lower trendline of the pennant, the technical outlook remains constructive. A clean break above the 0.6500 psychological barrier would likely trigger fresh buying and set the stage for a rally toward 0.6550 and beyond. On the downside, a drop below 0.6400 would put the bullish scenario on pause and expose the pair to a deeper pullback. For now, however, the price structure, trend bias, and momentum all point to the potential breakout of the pennant for further upside in the coming days.
Recommended Articles


