
NZD/USD rises as Trump touts Ukraine talks, Moody’s downgrade drags US Dollar
- Moody’s downgrades US credit rating, fueling USD weakness.
- Trump announces Russia-Ukraine ceasefire negotiations.
- New Zealand inflation expectations rise, but rate cut still expected.
The NZD/USD pair is climbing at the start of the week, trading around the 0.5900 level after President Donald Trump claimed credit for restarting Russia-Ukraine peace talks. While Trump’s announcement eased geopolitical tensions, the US Dollar remains pressured near 100.30, following a downgrade by Moody’s from AAA to AA1, citing concerns over US fiscal deterioration. This renewed pressure on the Greenback has supported the Kiwi, which also draws strength from rising New Zealand inflation expectations.
US President Donald Trump declared via Truth Social that Russia has agreed to return to ceasefire talks with Ukraine. Trump stated that both parties would begin negotiations immediately, adding that large trade between the US and Russia could resume after the war. Meanwhile, the Vatican has offered to host peace negotiations.
The US Dollar Index is slipping further toward 100.30 after Moody’s downgraded the US sovereign rating. The agency highlighted that the US no longer maintains sufficient fiscal metrics to justify a top-tier rating. This downgrade has increased risk premiums on US debt, which may limit the Fed’s room to cut rates in the near term. Several Fed officials stated that clarity on the economic outlook may not arrive until summer, and traders have now priced in around 75 basis points of rate cuts over the next 12 months.
In New Zealand, second-quarter inflation expectations ticked up to 2.3% from 2.2% in Q1. Despite this, markets still expect the Reserve Bank of New Zealand to reduce the Official Cash Rate by 25 basis points later this month, with a projected terminal rate of 2.75% by year-end.
Technical Analysis
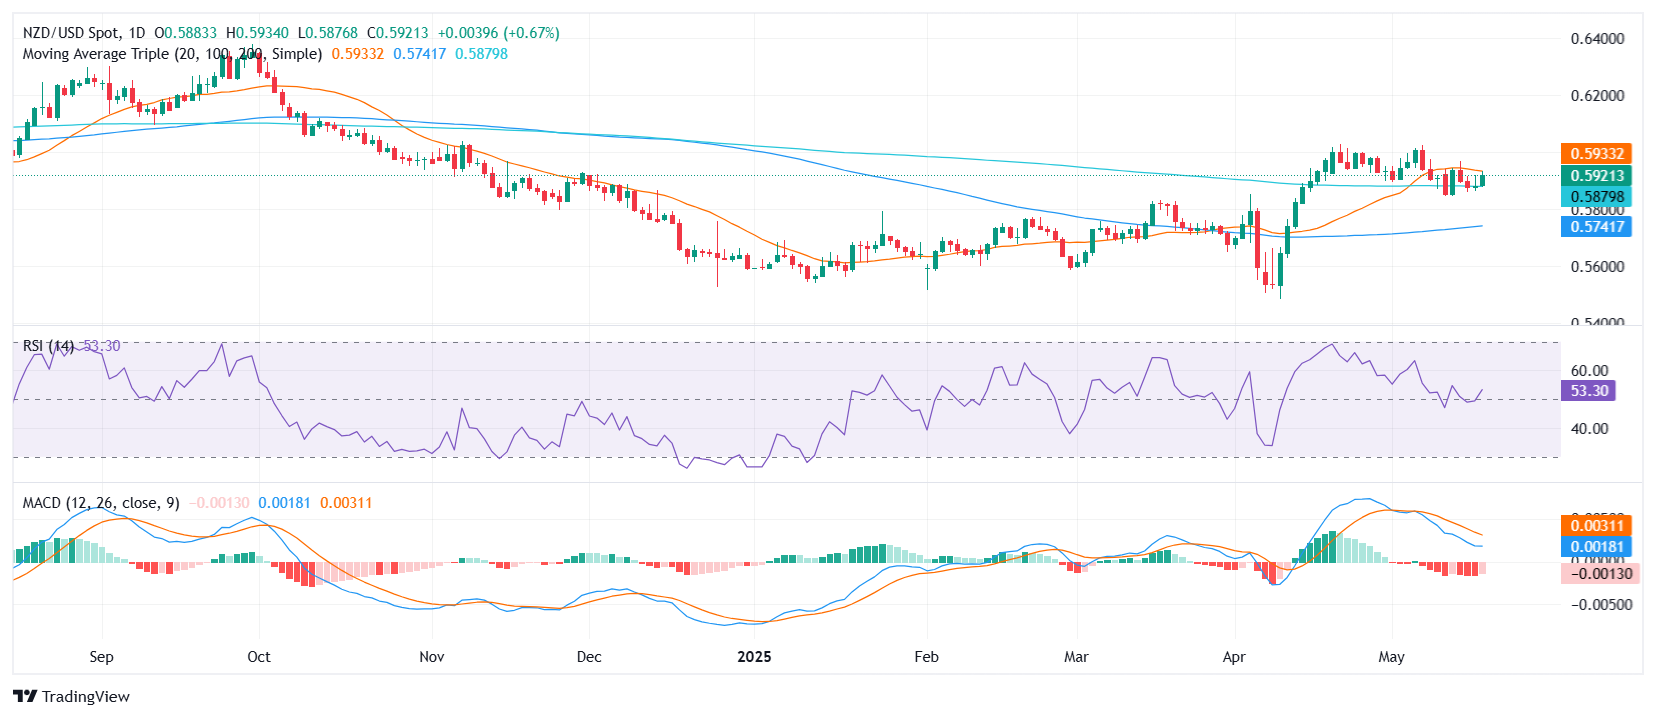
NZD/USD is displaying a bullish signal, trading around the 0.5900 zone and showing a sharp rise today. The pair sits mid-range between its daily low of 0.5876 and high of 0.5933. The Relative Strength Index (RSI) hovers in the 50s, indicating neutral conditions, while the Moving Average Convergence Divergence (MACD) signals sell momentum. The Awesome Oscillator trades around zero, suggesting neutral momentum, as does the Commodity Channel Index (20). The Stochastic %K (14, 3, 3) resides in the 20s, also signaling neutral conditions.
While the 20-day Simple Moving Average (SMA) suggests a sell signal, the 100-day and 200-day SMAs offer buy signals, aligning with the buy sentiment from the 10-day Exponential Moving Average (EMA) and 10-day SMA. Support levels are found near 0.5914, 0.5910, and 0.5905, while resistance is expected around 0.5925, 0.5932, and 0.5934. Fibonacci support clusters around 0.5300, 0.5500, and 0.5600, with resistance near 0.6000, 0.6200, and 0.6400.
Shifting to the 4-hour timeframe, the overall signal remains bullish, supported by buy signals from the 4-hour Momentum (10) and 4-hour MACD Level (12, 26), while the 4-hour Stochastic %K (14, 3, 3) is neutral. The 4-hour EMAs (10 and 20) and SMAs (10 and 20) all point towards a buy signal.
Daily chart
Recommended Articles


