

EUR/GBP Price Analysis: Bulls hold ground despite mixed signals post-European session

Source Fxstreet
  • EURGBP trades near the 0.8550 zone, holding modest daily gains after Thursday’s European session.
  • Bullish momentum is underpinned by positive signals from key moving averages despite mixed indicators.
  • Support rests near 0.8525–0.8527; resistance capped by the 0.8550–0.8560 region.

The EURGBP pair moved steadily near the 0.8550 zone on Thursday, holding onto slight intraday gains following the European session. The broader context remains dominated by Fed-related headlines, with investors reacting to cautious remarks from Governor Waller regarding tariffs and their economic implications. Meanwhile, US Dollar weakness following Trump and Bessent’s conflicting tariff messaging helped lift the euro modestly, though not without hesitation.

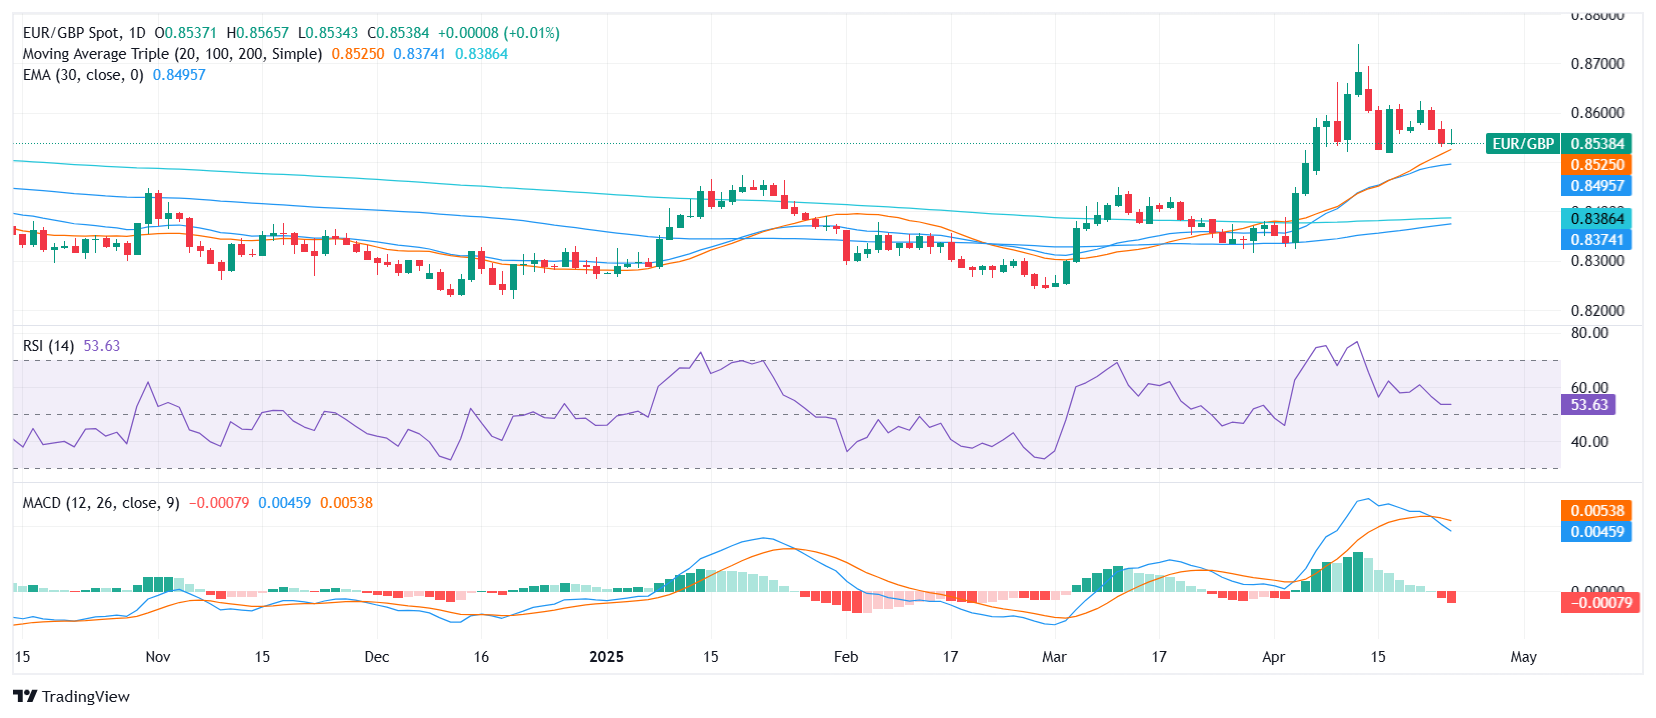
From a technical standpoint, EURGBP is flashing a bullish overall signal despite intraday consolidation. The pair is navigating the mid-range of 0.8534 to 0.8565, with the Relative Strength Index (RSI) at approximately 54 and signaling neutral momentum. The MACD is still flashing a mild sell signal, yet this is contrasted by slight buying pressure from Bull Bear Power. The Average Directional Index (ADX) remains below the trending threshold, confirming a lack of directional strength.

However, a key element of support for the bullish case lies in the moving averages. The 20-day, 100-day, and 200-day simple moving averages at 0.8525, 0.8374, and 0.8388 respectively are aligned to the upside. Similarly, the 30-day exponential and simple moving averages — at 0.8495 and 0.8475 — reinforce upward structure.

Daily chart

Disclaimer: For information purposes only. Past performance is not indicative of future results.
placeholder
Finding The Best Japan Stocks to Buy? These are Top Japanese Companies to Watch Discover the best Japanese stocks to buy, including AI semiconductor leaders, Buffett-backed trading houses, and undervalued Japan stocks benefiting from corporate reforms and yen trends.
Author  Mitrade
May 29, Fri
Discover the best Japanese stocks to buy, including AI semiconductor leaders, Buffett-backed trading houses, and undervalued Japan stocks benefiting from corporate reforms and yen trends.
placeholder
US August CPI lands tonight: after a 5.4% PPI shock, will the Fed hike on September 16?US August PPI came in at 5.4% year-on-year, above the 5.3% consensus, with core PPI at 4.6%. Traders have pushed the odds of a 25bp Fed hike on September 15-16 to around 70%. Tonight's CPI is the last major inflation print before the decision — here is the full calendar, the consensus numbers, and what a hot versus cool reading would mean for the dollar, yields, gold and stocks.
Author  Irene Q.
Sep 11, Fri
US August PPI came in at 5.4% year-on-year, above the 5.3% consensus, with core PPI at 4.6%. Traders have pushed the odds of a 25bp Fed hike on September 15-16 to around 70%. Tonight's CPI is the last major inflation print before the decision — here is the full calendar, the consensus numbers, and what a hot versus cool reading would mean for the dollar, yields, gold and stocks.
placeholder
Brent tests $108 as a key export pipeline stays shut — can the rally clear $110?Brent crude rose 2.55% to $106.97 and WTI 2.32% to $102.30 as a major regional export pipeline remained offline with no restart timeline. Front-month backwardation has widened to $5.53 from $3.84 a week ago, European gas is at its highest since December 2022, and one analyst sees $119.48 if talks stall.
Author  Irene Q.
Yesterday 07: 16
Brent crude rose 2.55% to $106.97 and WTI 2.32% to $102.30 as a major regional export pipeline remained offline with no restart timeline. Front-month backwardation has widened to $5.53 from $3.84 a week ago, European gas is at its highest since December 2022, and one analyst sees $119.48 if talks stall.
placeholder
Fed hike odds near 90% into Wednesday's decision — how to trade the dollar, gold and the S&P 500A 0.3% monthly core CPI print has lifted the market-implied probability of a 25bp Fed hike on 16 September to roughly 86.5% ~ 90%, which would be the first increase since July 2023. Here is the decision timeline, the pricing versus the forecasts, both scenarios, and the key levels for the dollar, gold and the S&P 500.
Author  Suzie
Yesterday 07: 49
A 0.3% monthly core CPI print has lifted the market-implied probability of a 25bp Fed hike on 16 September to roughly 86.5% ~ 90%, which would be the first increase since July 2023. Here is the decision timeline, the pricing versus the forecasts, both scenarios, and the key levels for the dollar, gold and the S&P 500.
placeholder
Silver Price Forecast: XAG/USD falls to near $63.50 amid Fed hike bets, higher oil pricesSilver price (XAG/USD) loses its gains from the previous day, trading around $63.50 per troy ounce during Asian hours on Monday. Non-yielding Silver is currently facing significant headwinds driven by rising Federal Reserve (Fed) rate-hike expectations for the upcoming September decision.
Author  FXStreet
23 hours ago
Silver price (XAG/USD) loses its gains from the previous day, trading around $63.50 per troy ounce during Asian hours on Monday. Non-yielding Silver is currently facing significant headwinds driven by rising Federal Reserve (Fed) rate-hike expectations for the upcoming September decision.
Related Instrument
goTop
quote