

USD/JPY Price Analysis: Dives below 150.00 amid BoJ member’s hawkish comments

Source Fxstreet
  • USD/JPY down 0.47%, reacting to BoJ's Takata hinting at possible exit from stimulus, stirring market speculation.
  • Technical analysis highlights crucial support at 149.21, with potential rebound or further decline in focus.
  • Breach below 149.21 could lead to further losses, targeting 148.31 and possibly extending to the 146.00 region.

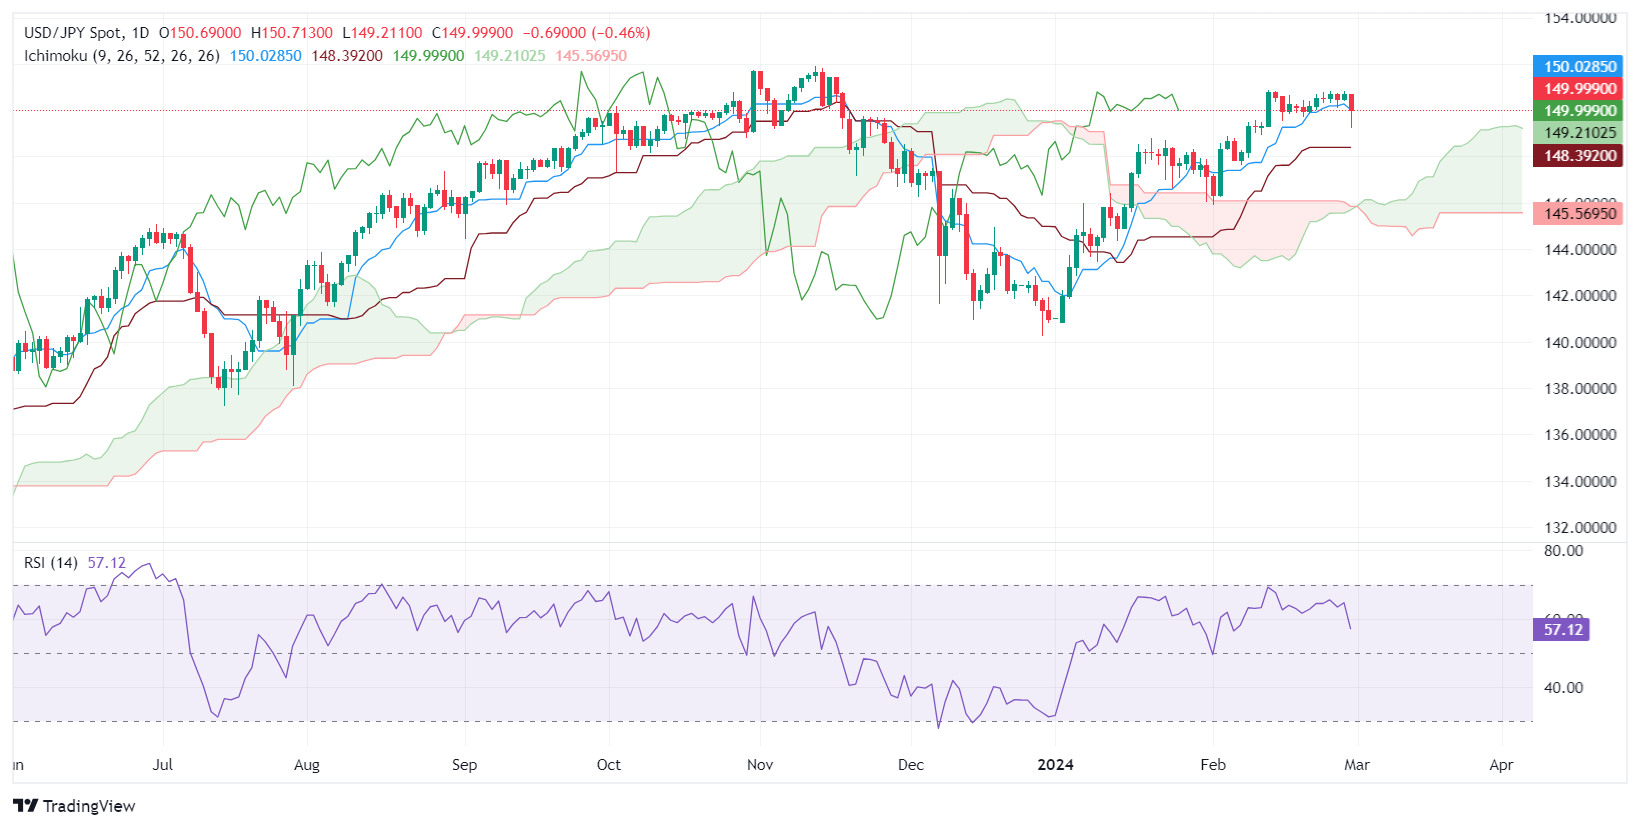
The USD/JPY trades with losses below the Tenkan-Sen level of 150.03, following “hawkish” comments by a Bank of Japan (BoJ) member, Takata. He said the BoJ needs to consider taking a flexible response, including exiting from monetary policy stimulus, which investors perceived as a normalization of monetary policy. At the time of writing, the pair exchanged hands at 149.98, down 0.47%.

USD/JPY Price Analysis: Technical outlook

The daily chart shows the pair printed a low at around 149.21, at the Senkou Span A level, before resuming to the upside and thus remaining shy of the 150.00 figure. A breach of the latter will expose the Tenkan-Sen and a resumption of the ongoing uptrend towards the 151.00 mark.

Conversely, if the USD/JPY stays below the 150.00 mark and achieves a daily close below 149.21, look for a fall to the Kijun-Sen at 148.31, ahead of the 148.00 mark. If surpassed, the pair could aim toward the top of the Ichimoku Cloud (Kumo) at around 146.00-146.15.

USD/JPY Price Action – Daily Chart
 

Disclaimer: For information purposes only. Past performance is not indicative of future results.
placeholder
Finding The Best Japan Stocks to Buy? These are Top Japanese Companies to Watch Discover the best Japanese stocks to buy, including AI semiconductor leaders, Buffett-backed trading houses, and undervalued Japan stocks benefiting from corporate reforms and yen trends.
Author  Mitrade
May 29, Fri
Discover the best Japanese stocks to buy, including AI semiconductor leaders, Buffett-backed trading houses, and undervalued Japan stocks benefiting from corporate reforms and yen trends.
placeholder
US August CPI lands tonight: after a 5.4% PPI shock, will the Fed hike on September 16?US August PPI came in at 5.4% year-on-year, above the 5.3% consensus, with core PPI at 4.6%. Traders have pushed the odds of a 25bp Fed hike on September 15-16 to around 70%. Tonight's CPI is the last major inflation print before the decision — here is the full calendar, the consensus numbers, and what a hot versus cool reading would mean for the dollar, yields, gold and stocks.
Author  Irene Q.
Sep 11, Fri
US August PPI came in at 5.4% year-on-year, above the 5.3% consensus, with core PPI at 4.6%. Traders have pushed the odds of a 25bp Fed hike on September 15-16 to around 70%. Tonight's CPI is the last major inflation print before the decision — here is the full calendar, the consensus numbers, and what a hot versus cool reading would mean for the dollar, yields, gold and stocks.
placeholder
Brent tests $108 as a key export pipeline stays shut — can the rally clear $110?Brent crude rose 2.55% to $106.97 and WTI 2.32% to $102.30 as a major regional export pipeline remained offline with no restart timeline. Front-month backwardation has widened to $5.53 from $3.84 a week ago, European gas is at its highest since December 2022, and one analyst sees $119.48 if talks stall.
Author  Irene Q.
Yesterday 07: 16
Brent crude rose 2.55% to $106.97 and WTI 2.32% to $102.30 as a major regional export pipeline remained offline with no restart timeline. Front-month backwardation has widened to $5.53 from $3.84 a week ago, European gas is at its highest since December 2022, and one analyst sees $119.48 if talks stall.
placeholder
Fed hike odds near 90% into Wednesday's decision — how to trade the dollar, gold and the S&P 500A 0.3% monthly core CPI print has lifted the market-implied probability of a 25bp Fed hike on 16 September to roughly 86.5% ~ 90%, which would be the first increase since July 2023. Here is the decision timeline, the pricing versus the forecasts, both scenarios, and the key levels for the dollar, gold and the S&P 500.
Author  Suzie
Yesterday 07: 49
A 0.3% monthly core CPI print has lifted the market-implied probability of a 25bp Fed hike on 16 September to roughly 86.5% ~ 90%, which would be the first increase since July 2023. Here is the decision timeline, the pricing versus the forecasts, both scenarios, and the key levels for the dollar, gold and the S&P 500.
placeholder
Silver Price Forecast: XAG/USD falls to near $63.50 amid Fed hike bets, higher oil pricesSilver price (XAG/USD) loses its gains from the previous day, trading around $63.50 per troy ounce during Asian hours on Monday. Non-yielding Silver is currently facing significant headwinds driven by rising Federal Reserve (Fed) rate-hike expectations for the upcoming September decision.
Author  FXStreet
Yesterday 10: 37
Silver price (XAG/USD) loses its gains from the previous day, trading around $63.50 per troy ounce during Asian hours on Monday. Non-yielding Silver is currently facing significant headwinds driven by rising Federal Reserve (Fed) rate-hike expectations for the upcoming September decision.
Related Instrument
goTop
quote