EUR/GBP Price Analysis: Holds bullish tone despite minor decline

Source Fxstreet
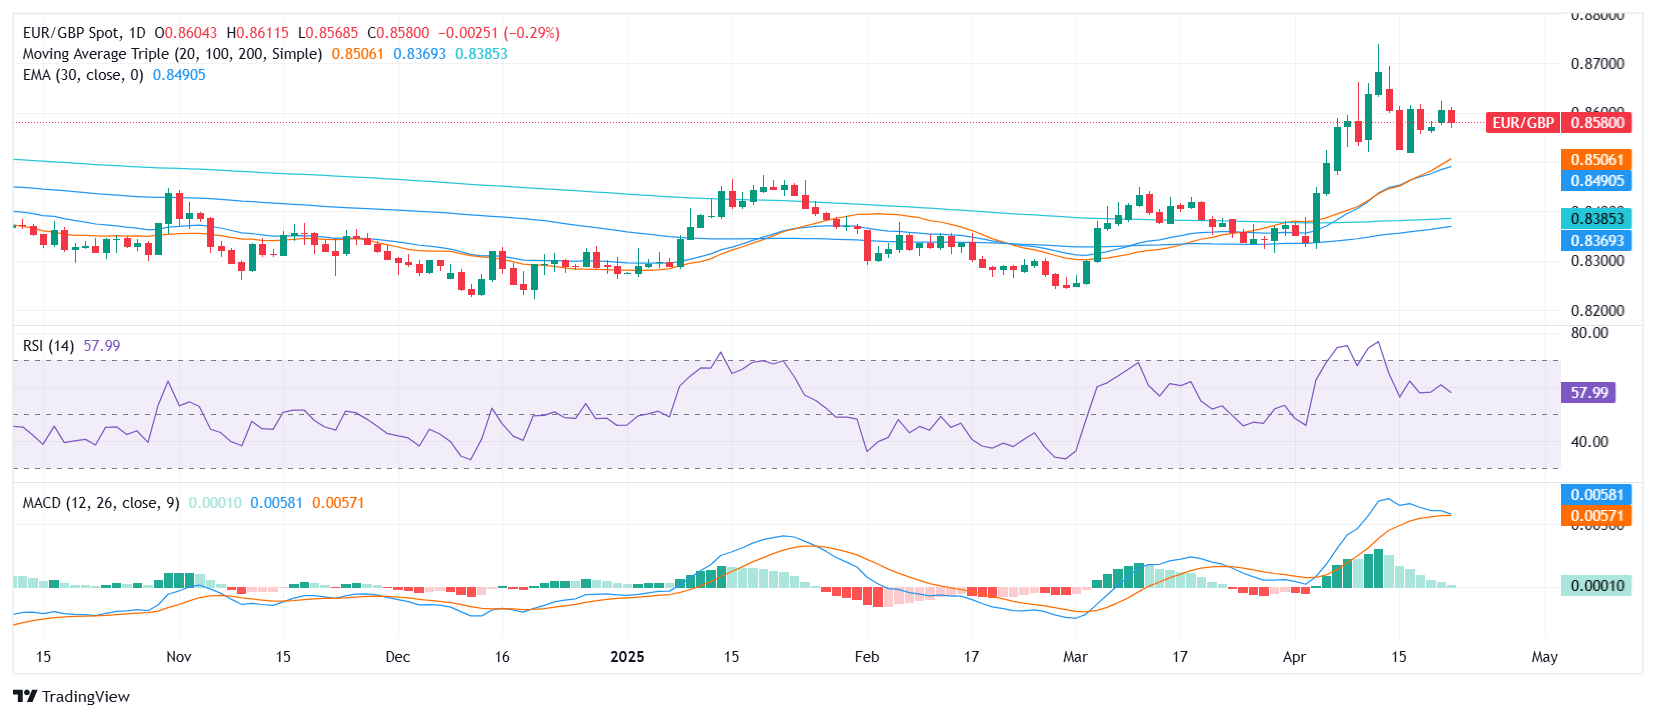
  • EUR/GBP trades near the 0.8600 zone after easing modestly post-European session.
  • Momentum indicators send mixed signals, but moving averages remain aligned to the upside.
  • Support rests at 0.8577, 0.8570, and 0.8546; resistance is seen near 0.8591.

The EURGBP pair is exhibiting a bullish overall signal, currently trading around the 0.8600 area after slipping slightly during Tuesday’s session following the European close. The pair remains comfortably mid-range between the day’s low of 0.8569 and the upper boundary near 0.8611, suggesting consolidation within an upward trend.

Technically, momentum indicators are mixed. The Relative Strength Index (RSI) holds neutral near the 58 level, while the MACD continues to print a buy signal. However, the Stochastic RSI is also neutral, and the Momentum indicator tilts slightly bearish, hinting at some hesitation among buyers in the short term.

Still, the broader technical backdrop remains constructive. The 20-day, 100-day, and 200-day Simple Moving Averages (SMAs), located at 0.8506, 0.8369, and 0.8386 respectively, are all pointing upward. Bullish confirmation also comes from the 10-day and 30-day Exponential Moving Averages (EMAs), holding above 0.8569 and 0.8490, reinforcing near-term strength.

Support is seen at 0.8577, followed by 0.8570 and 0.8546. On the upside, resistance is expected around the 0.8591 area. The overall bias remains positive so long as price holds above key averages heading into the Asian session.


EUR/GBP Daily chart


Disclaimer: For information purposes only. Past performance is not indicative of future results.
placeholder
US May CPI Preview: Rising Inflation May Push Up Fed Rate Hike Expectations, How Will US Stocks, Dollar, Gold React? The U.S. Bureau of Labor Statistics will release May CPI data at 8:30 AM ET on June 10. This report is the most critical inflation reading ahead of the Federal Reserve's policy meeting on
Author  TradingKey
7 hours ago
The U.S. Bureau of Labor Statistics will release May CPI data at 8:30 AM ET on June 10. This report is the most critical inflation reading ahead of the Federal Reserve's policy meeting on
placeholder
WTI Crude Oil Falls to $90 Level. Iran Situation Cools Suddenly, Strait of Hormuz June Opening Seen Unlikely On June 8, tensions in the Iran conflict cooled abruptly, and both major crude oil futures fell. WTI crude futures briefly retreated to around the $90 level. As of press time, it was up 0
Author  TradingKey
10 hours ago
On June 8, tensions in the Iran conflict cooled abruptly, and both major crude oil futures fell. WTI crude futures briefly retreated to around the $90 level. As of press time, it was up 0
placeholder
WTI edges lower to near $89.50 as Iran, Israel agree to halt attacksWest Texas Intermediate (WTI) oil price edges lower after registering over 1% losses in the previous day, trading around $89.40 per barrel during the Asian hours on Tuesday.
Author  FXStreet
16 hours ago
West Texas Intermediate (WTI) oil price edges lower after registering over 1% losses in the previous day, trading around $89.40 per barrel during the Asian hours on Tuesday.
placeholder
Gold Drops Below $4,300 Erasing Year-to-Date Gains. This Week’s CPI May Ignite Rate Hike Expectations Will Gold Still Rise in 2026?During Monday's Asian session, both spot and futures gold prices fell below the $4,300/oz support level. Spot gold touched an intraday low of $4,268.42, its lowest level since March 23, e
Author  TradingKey
Yesterday 09: 58
During Monday's Asian session, both spot and futures gold prices fell below the $4,300/oz support level. Spot gold touched an intraday low of $4,268.42, its lowest level since March 23, e
placeholder
Bitcoin Supply In Loss Crosses Critical Threshold — Bullish Reversal Next?After days of steep downward movement, the price of Bitcoin appears to have found a somewhat reliable anchor around the $60,000 region. However, recent on-chain data suggests that the premier
Author  NewsBTC
Yesterday 01: 16
After days of steep downward movement, the price of Bitcoin appears to have found a somewhat reliable anchor around the $60,000 region. However, recent on-chain data suggests that the premier
Related Instrument
goTop
quote