USD/JPY Price Analysis: Stays firm near YTD high amid US data, intervention fears

Source Fxstreet
  • USD/JPY trades slightly up, navigating through intervention concerns and US economic data impact.
  • Technical analysis shows potential for uptrend continuation if the 151.00 level is reclaimed by buyers.
  • Key support levels identified, with a drop below 150.26 possibly signaling a shift towards 150.00 and lower.

The USD/JPY remains subdued during the North American session, trading at around 150.71, up by 013% on Wednesday. Economic data releases from the United States (US) maintain the pair within familiar levels despite threats by Japanese authorities to step into the Forex markets.

USD/JPY Price Analysis: Technical outlook

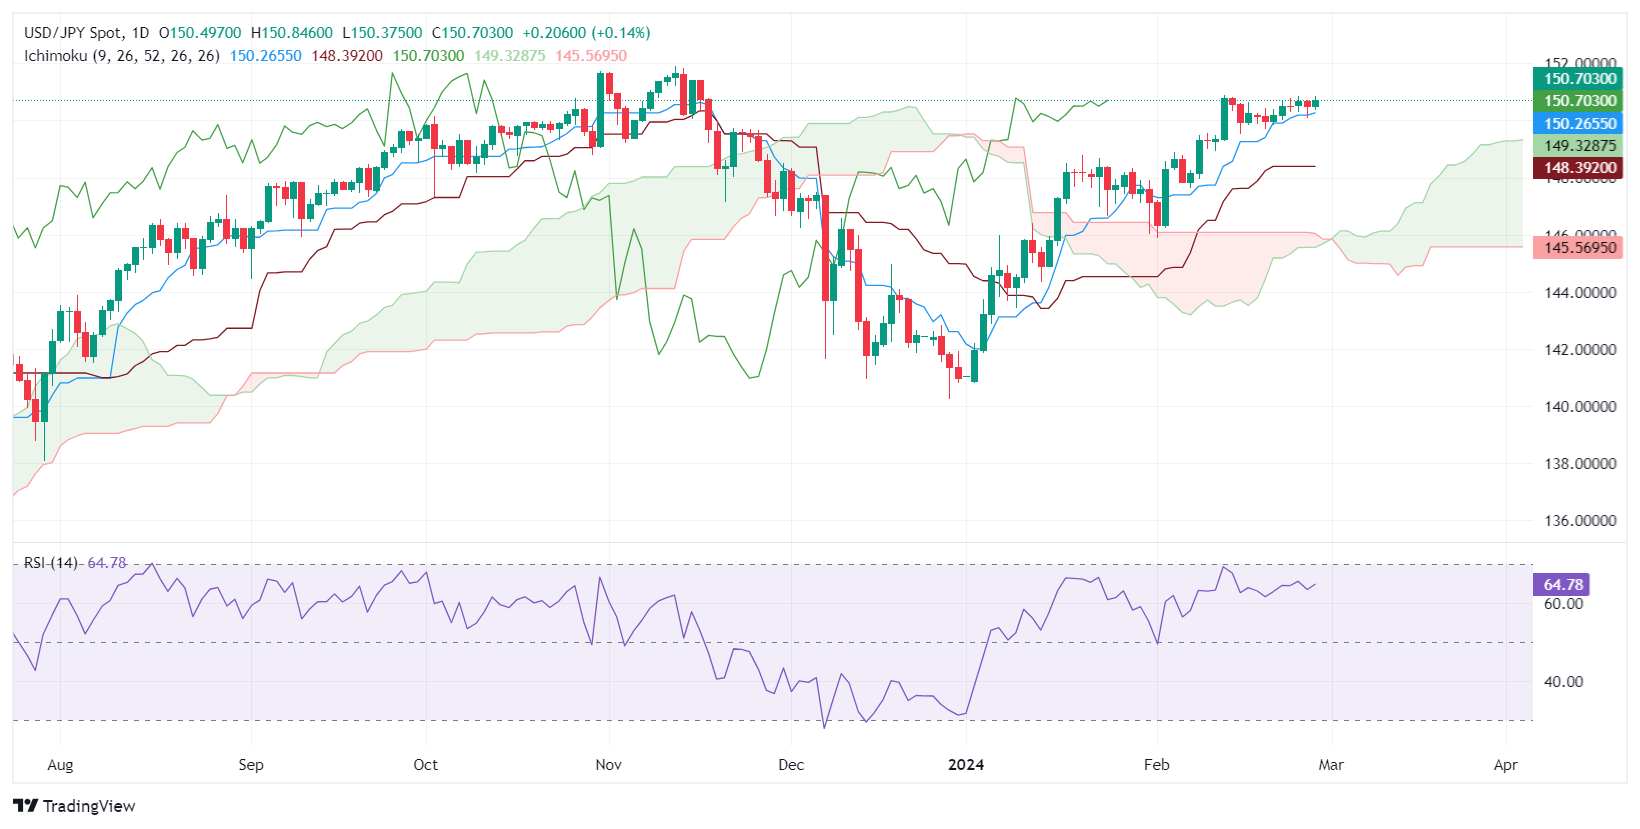
As the USD/JPY daily chart depicts, the upward bias remains intact. The Relative Strength Index (RSI) is bullish but flat, an indication of consolidation, at around the current year-to-date (YTD) high of 150.88. If buyers would like to extend the uptrend, they must reclaim the 151.00 figure, so they could challenge last year’s high of 151.91.

Conversely, if sellers’ step into the market and drive the exchange rate below the Tenkan-Sen at 150.26, that would expose the 150.00 figure. Further downside is seen below the Senkou Span A at 149.32, followed by 149.00, and the Kijun-Sen at 148.39.

USD/JPY Price Action – Daily Chart


Disclaimer: For information purposes only. Past performance is not indicative of future results.
placeholder
Bitcoin Suffers Year’s Strongest Waterfall-Style Decline. Will It Next Drop to the $60,000 Mark?During the Asian trading session on June 4, Bitcoin continued its multi-day slump, briefly dropping below the $62,000 mark to $61,338. As of press time, Bitcoin was trading at $63,844, wi
Author  TradingKey
13 hours ago
During the Asian trading session on June 4, Bitcoin continued its multi-day slump, briefly dropping below the $62,000 mark to $61,338. As of press time, Bitcoin was trading at $63,844, wi
placeholder
Bitcoin drops below $65K amid reinforced bear market signalsBitcoin (BTC) dipped further below $65,000 on Wednesday, with onchain data from Glassnode signaling a market firmly in a bear phase. The decline has pushed prices back into a key valuation range between the Realized Price and the True Market Mean.
Author  FXStreet
21 hours ago
Bitcoin (BTC) dipped further below $65,000 on Wednesday, with onchain data from Glassnode signaling a market firmly in a bear phase. The decline has pushed prices back into a key valuation range between the Realized Price and the True Market Mean.
placeholder
Forex Today: US Dollar stays resilient ahead of key US dataHere is what you need to know on Wednesday, June 3:
Author  FXStreet
Yesterday 10: 27
Here is what you need to know on Wednesday, June 3:
placeholder
$1.5 Billion in Crypto Assets Liquidated, Bitcoin Falls Below $66,000 Mark. What Is the Reason?On June 2, Eastern Time, the cryptocurrency market suffered its most severe wave of concentrated liquidations so far this year. Bitcoin ( BTC) fell below the $70,000 psychological support
Author  TradingKey
Yesterday 06: 32
On June 2, Eastern Time, the cryptocurrency market suffered its most severe wave of concentrated liquidations so far this year. Bitcoin ( BTC) fell below the $70,000 psychological support
placeholder
WTI rises to near $93.00 as Iran launches missiles toward Kuwait, BahrainWest Texas Intermediate (WTI) gains ground for the third successive day, trading around $92.90 per barrel during the Asian hours on Wednesday.
Author  FXStreet
Yesterday 01: 24
West Texas Intermediate (WTI) gains ground for the third successive day, trading around $92.90 per barrel during the Asian hours on Wednesday.
Related Instrument
goTop
quote