EUR/USD Price Analysis: Hovers around the major level of 1.0850

Source Fxstreet
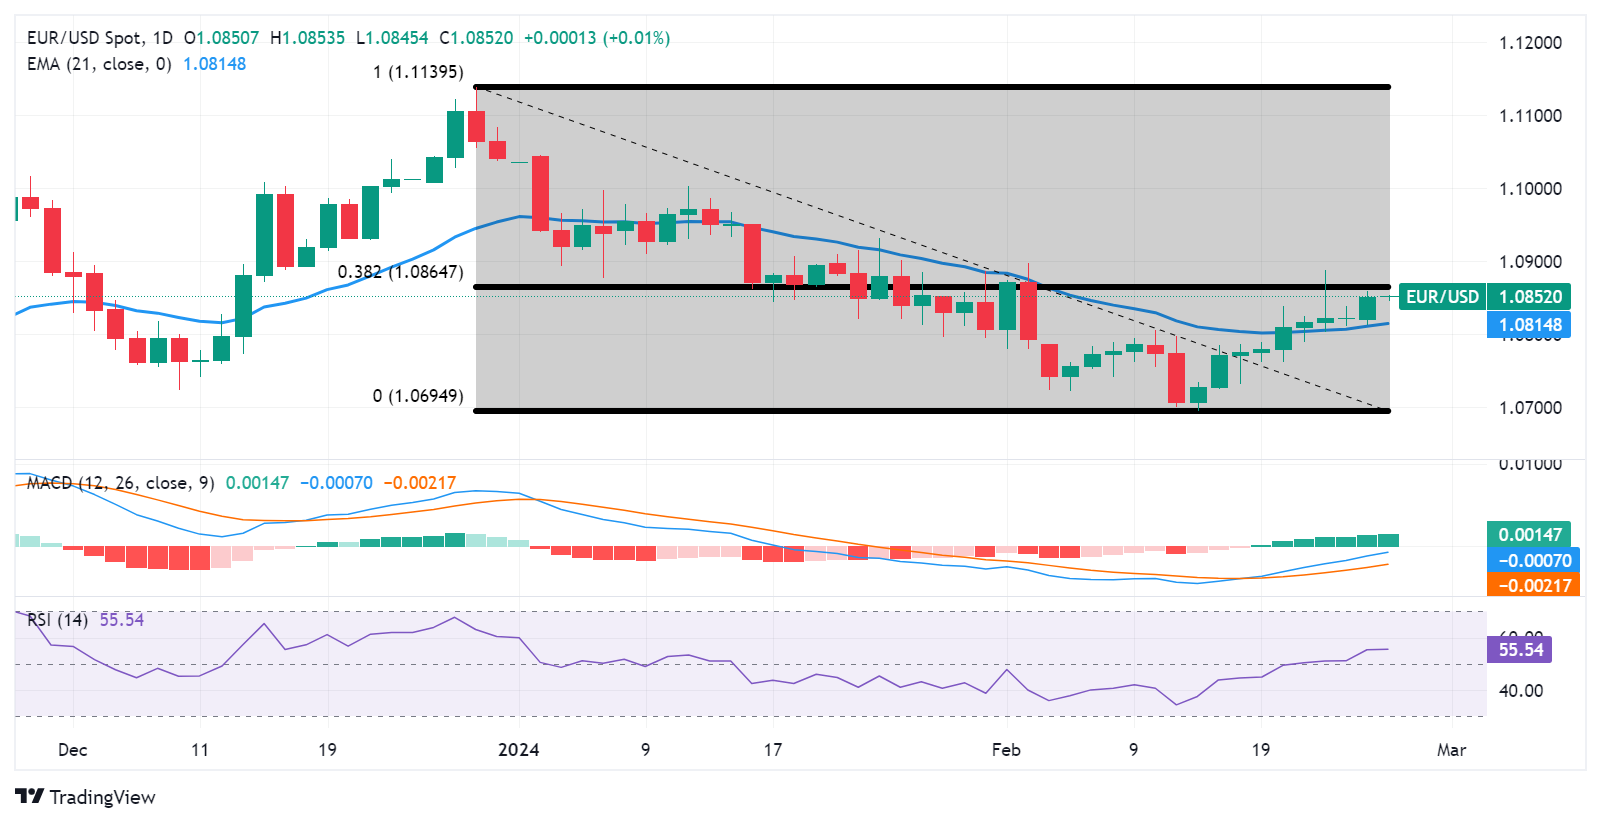
  • EUR/USD could meet the immediate resistance at the 38.2% Fibonacci retracement level of 1.0864.
  • The lagging indicator MACD implies a potential shift towards bullish momentum for the pair.
  • The key support area appears around the 21-day EMA at 1.0814 and the psychological level of 1.0800.

EUR/USD continues its winning streak that began on February 14, with the subdued US Dollar (USD), potentially influenced by the lower US Treasury yields. Consequently, during Tuesday's Asian session, the EUR/USD pair hovers around 1.0850.

Immediate resistance levels for the EUR/USD pair are identified at the 38.2% Fibonacci retracement level of 1.0864, followed by February's high of 1.0897, which aligns with the significant psychological barrier at 1.0900.

The technical analysis suggests a bullish sentiment for the EUR/USD pair. The 14-day Relative Strength Index (RSI) is positioned above the 50 mark, indicating strength in the upward momentum.

Additionally, the Moving Average Convergence Divergence (MACD) shows a divergence above the signal line, despite being below the centerline. This lagging indicator implies a potential shift towards bullish momentum for the EUR/USD pair.

On the downside, the EUR/USD pair could find the key support around the 21-day Exponential Moving Average (EMA) at 1.0814 followed by the psychological support of 1.0800 level. A break below this level could prompt the pair to retest February’s low at 1.0694 level.

EUR/USD: Daily Chart


Disclaimer: For information purposes only. Past performance is not indicative of future results.
placeholder
Bitcoin loses $73,000 as US-Iran escalation, ETF outflows deepen crypto market sell-offThe broader cryptocurrency market is down $2.45 trillion on Thursday, from $2.54 trillion the previous day, led by Bitcoin’s (BTC) decline below $73,000.
Author  FXStreet
May 28, Thu
The broader cryptocurrency market is down $2.45 trillion on Thursday, from $2.54 trillion the previous day, led by Bitcoin’s (BTC) decline below $73,000.
placeholder
Bitcoin Price Forecast: BTC risks losing $70,000 as AI and chip rally steal the spotlightBitcoin (BTC) edges below $73,000 at press time on Monday, extending its decline under the prevailing downside pressure from three consecutive weeks of losses.
Author  FXStreet
Jun 01, Mon
Bitcoin (BTC) edges below $73,000 at press time on Monday, extending its decline under the prevailing downside pressure from three consecutive weeks of losses.
placeholder
Gold declines below $4,500 as Iran tensions stoke inflation fears and bolster Fed hike betsGold price (XAU/USD) declines to around $4,485 during the early Asian session on Tuesday. The precious metal loses ground as renewed tensions in the Middle East continue to fuel concerns over inflation and expectations of elevated interest rates.
Author  FXStreet
Jun 02, Tue
Gold price (XAU/USD) declines to around $4,485 during the early Asian session on Tuesday. The precious metal loses ground as renewed tensions in the Middle East continue to fuel concerns over inflation and expectations of elevated interest rates.
placeholder
WTI rises to near $93.00 as Iran launches missiles toward Kuwait, BahrainWest Texas Intermediate (WTI) gains ground for the third successive day, trading around $92.90 per barrel during the Asian hours on Wednesday.
Author  FXStreet
Yesterday 01: 24
West Texas Intermediate (WTI) gains ground for the third successive day, trading around $92.90 per barrel during the Asian hours on Wednesday.
placeholder
Forex Today: US Dollar stays resilient ahead of key US dataHere is what you need to know on Wednesday, June 3:
Author  FXStreet
15 hours ago
Here is what you need to know on Wednesday, June 3:
Related Instrument
goTop
quote