EUR/USD Price Analysis: Consolidates near 1.0800 with bullish trend under soft pressure

Source Fxstreet
  • EUR/USD was seen hovering near the 1.0800 area after posting mild losses on Wednesday.
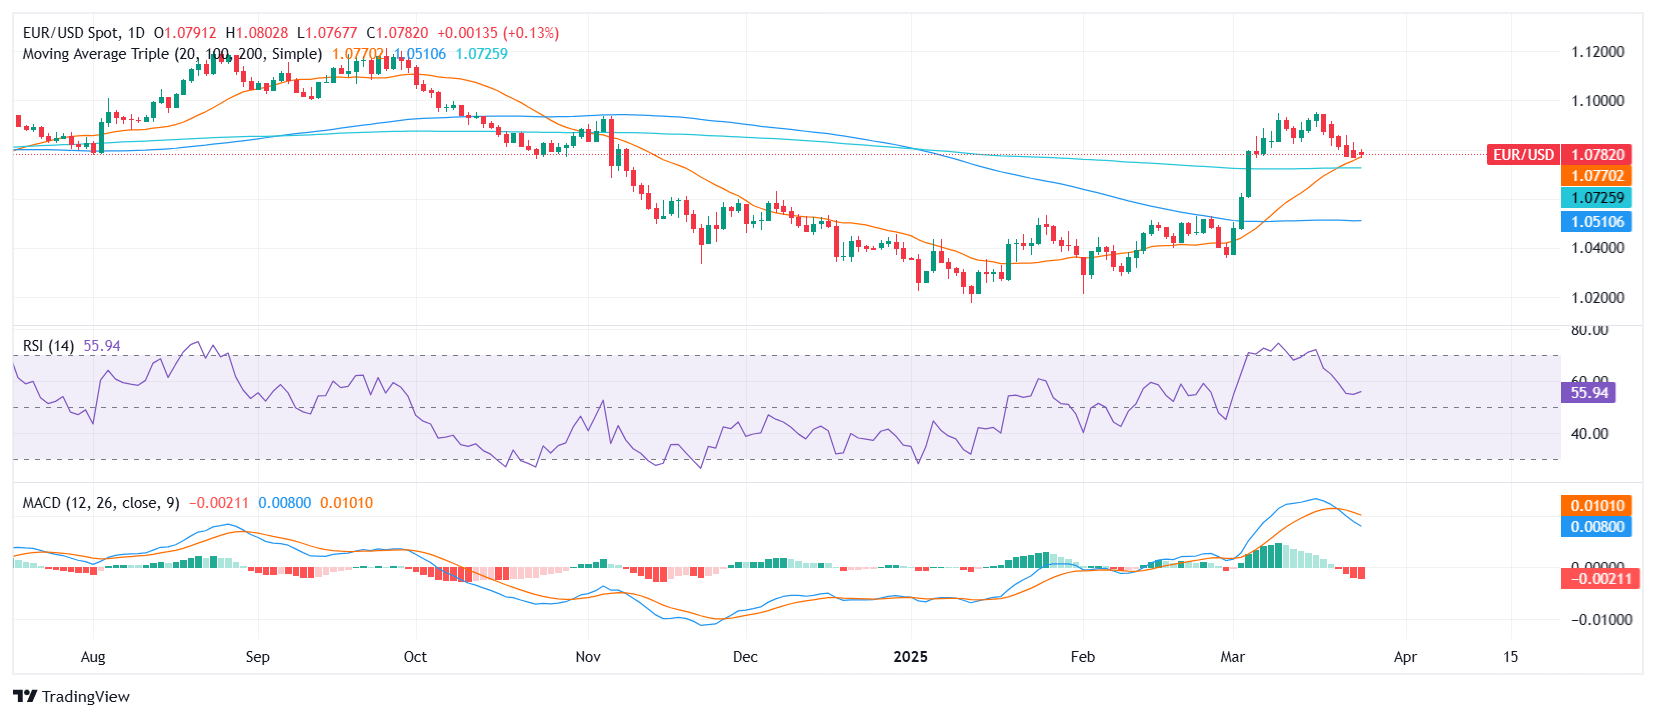
  • Despite intraday softness, the broader trend remains bullish, supported by upward-sloping moving averages.
  • MACD shows a sell signal while support lies at 1.0770 and resistance at 1.0820 and beyond.

EUR/USD traded with slight weakness on Wednesday's session after the European close, seen hovering around the 1.0800 zone. The pair remained within its daily range, reflecting limited directional conviction, but still holding above key moving averages that keep the broader bullish trend intact.

From a technical standpoint, the pair is supported by the 20-day Simple Moving Average at 1.0773, along with the 100-day and 200-day SMAs at 1.0520 and 1.0729, respectively—all pointing higher. The 30-day EMA and SMA also reinforce the bullish structure, with the pair consistently trading above these dynamic supports.

However, some mixed signals arise from the oscillators. The Relative Strength Index sits at 57, reflecting neutral momentum, while the Average Directional Index prints at 29, suggesting moderate trend strength. The MACD, despite remaining above the signal line, has turned lower and now issues a soft sell signal. Meanwhile, the combined RSI/Stochastic indicator confirms a neutral stance.

Looking at levels, initial support comes at 1.0773 followed by 1.0765. On the upside, resistance is seen around 1.0820 and later near 1.0853, where bulls may encounter further challenges. Until a clear breakout materializes, the pair may continue consolidating within this range.

EUR/USD daily chart

Disclaimer: For information purposes only. Past performance is not indicative of future results.
placeholder
$180 Oil Prices Imminent? Saudi Arabia Warns: Crisis to Last Until Late April, Oil Prices Will Break Historic HighsThe continuous escalation of geopolitical conflicts in the Middle East is pushing global energy markets toward their most severe test in nearly 20 years.The Wall Street Journal reports th
Author  TradingKey
7 hours ago
The continuous escalation of geopolitical conflicts in the Middle East is pushing global energy markets toward their most severe test in nearly 20 years.The Wall Street Journal reports th
placeholder
Gold tumbles below $4,650 as inflation fears and liquidity squeeze weighGold price (XAU/USD) remains under selling pressure near $4,640 during the early Asian session on Friday. The precious metal extends the decline as soaring crude oil and energy prices, driven by the escalating US-Israeli war with Iran, reignite inflation fears.
Author  FXStreet
16 hours ago
Gold price (XAU/USD) remains under selling pressure near $4,640 during the early Asian session on Friday. The precious metal extends the decline as soaring crude oil and energy prices, driven by the escalating US-Israeli war with Iran, reignite inflation fears.
placeholder
Bitcoin Drops Below $70,000 as Crypto Rally Fails to MaterializeThe crypto market experienced a significant pullback, Bitcoin (BTCUSD) fell below the key $70,000 mark during intraday trading, triggering short-term stop-loss orders and causing market s
Author  TradingKey
Yesterday 10: 20
The crypto market experienced a significant pullback, Bitcoin (BTCUSD) fell below the key $70,000 mark during intraday trading, triggering short-term stop-loss orders and causing market s
placeholder
Gold falls below $4,850 as Fed holds rates steadyGold price (XAU/USD) faces some selling pressure near $4,830 during the early Asian session on Thursday.
Author  FXStreet
Yesterday 01: 59
Gold price (XAU/USD) faces some selling pressure near $4,830 during the early Asian session on Thursday.
placeholder
WTI Crude Prices Capped at $100, Has the Rally Ended? How to Trade the Short Term? Today (March 18), WTI crude oil continued to exhibit significant short-term volatility, driven by a tug-of-war between headlines and data. Intraday, prices retreated from Tuesday's high o
Author  TradingKey
Mar 18, Wed
Today (March 18), WTI crude oil continued to exhibit significant short-term volatility, driven by a tug-of-war between headlines and data. Intraday, prices retreated from Tuesday's high o
Related Instrument
goTop
quote