EUR/USD Price Analysis: Correction deepens as sellers eye key technical floor

Source Fxstreet
  • EUR/USD trades near the 1.0800 zone, mildly lower after Monday’s European session.
  • Bearish momentum builds as the pair extends its losing streak to four consecutive sessions.
  • Downside could accelerate toward 1.0730 if sellers break through current support levels.

During Monday’s session after the European close, EUR/USD continued to retreat and was last seen moving around the 1.0800 area. The pair remains in a corrective phase after its strong March rally, with technical signals now favoring further downside pressure. The latest price action marks the fourth consecutive daily loss, suggesting that bulls are stepping aside for now.

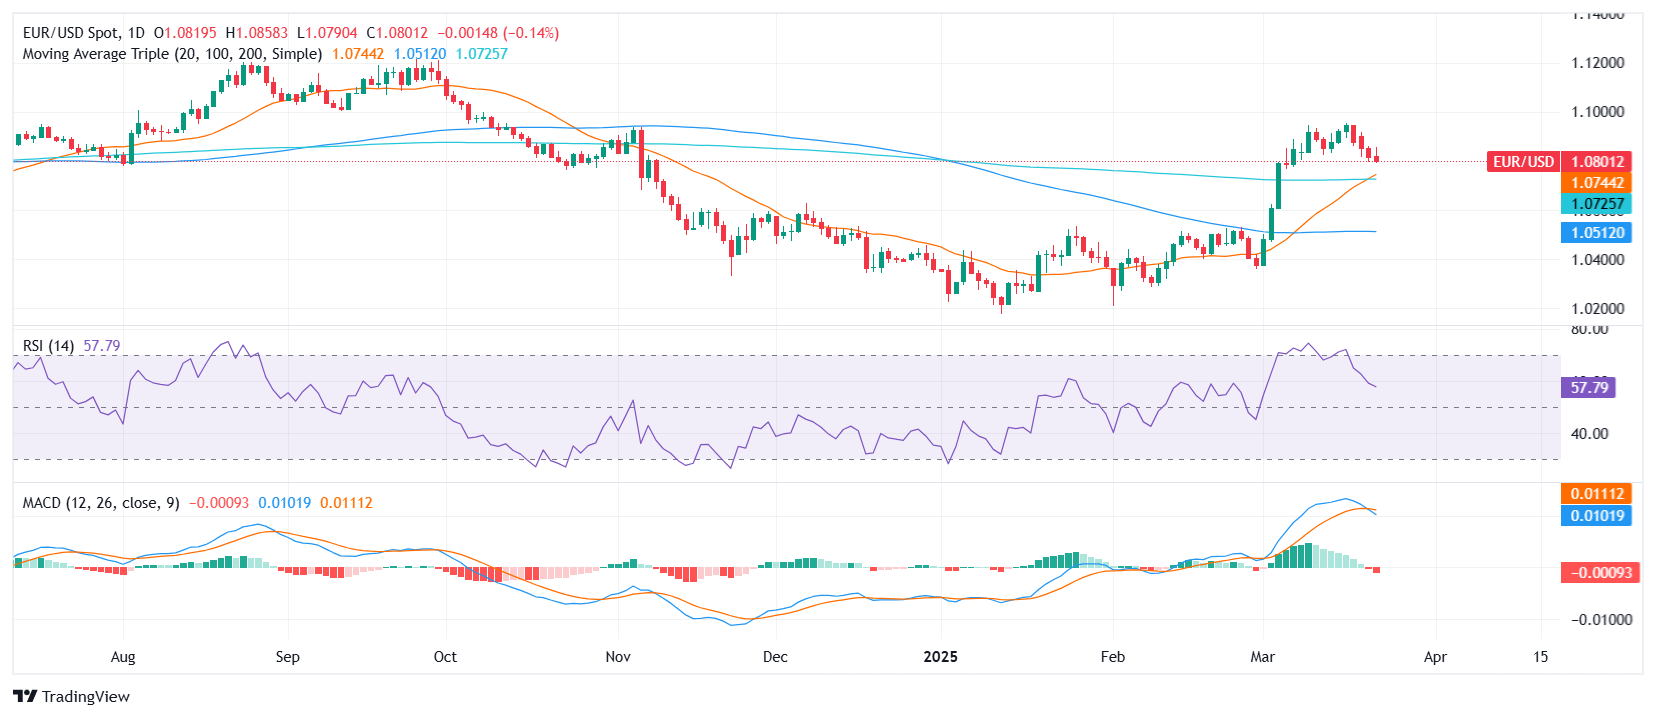
From a technical standpoint, the Relative Strength Index (RSI) has sharply declined but still remains deep in postivie territory near the 60 level, which signals that the pair may continue correcting until momentum resets. Meanwhile, the Moving Average Convergence Divergence (MACD) has begun to print red bars, highlighting a shift in momentum that supports additional downside pressure.

The next critical support comes into play around the 1.0730 region, where the 100-day and 200-day Simple Moving Averages converge. A break below that floor could reinforce the bearish case and open the door toward 1.0670. On the flip side, any bullish recovery would likely find initial resistance near 1.0860, followed by the psychological 1.0900 handle.

EUR/USD daily chart

Disclaimer: For information purposes only. Past performance is not indicative of future results.
placeholder
Bitcoin Suffers Year’s Strongest Waterfall-Style Decline. Will It Next Drop to the $60,000 Mark?During the Asian trading session on June 4, Bitcoin continued its multi-day slump, briefly dropping below the $62,000 mark to $61,338. As of press time, Bitcoin was trading at $63,844, wi
Author  TradingKey
10 hours ago
During the Asian trading session on June 4, Bitcoin continued its multi-day slump, briefly dropping below the $62,000 mark to $61,338. As of press time, Bitcoin was trading at $63,844, wi
placeholder
Bitcoin drops below $65K amid reinforced bear market signalsBitcoin (BTC) dipped further below $65,000 on Wednesday, with onchain data from Glassnode signaling a market firmly in a bear phase. The decline has pushed prices back into a key valuation range between the Realized Price and the True Market Mean.
Author  FXStreet
19 hours ago
Bitcoin (BTC) dipped further below $65,000 on Wednesday, with onchain data from Glassnode signaling a market firmly in a bear phase. The decline has pushed prices back into a key valuation range between the Realized Price and the True Market Mean.
placeholder
Forex Today: US Dollar stays resilient ahead of key US dataHere is what you need to know on Wednesday, June 3:
Author  FXStreet
Yesterday 10: 27
Here is what you need to know on Wednesday, June 3:
placeholder
$1.5 Billion in Crypto Assets Liquidated, Bitcoin Falls Below $66,000 Mark. What Is the Reason?On June 2, Eastern Time, the cryptocurrency market suffered its most severe wave of concentrated liquidations so far this year. Bitcoin ( BTC) fell below the $70,000 psychological support
Author  TradingKey
Yesterday 06: 32
On June 2, Eastern Time, the cryptocurrency market suffered its most severe wave of concentrated liquidations so far this year. Bitcoin ( BTC) fell below the $70,000 psychological support
placeholder
WTI rises to near $93.00 as Iran launches missiles toward Kuwait, BahrainWest Texas Intermediate (WTI) gains ground for the third successive day, trading around $92.90 per barrel during the Asian hours on Wednesday.
Author  FXStreet
Yesterday 01: 24
West Texas Intermediate (WTI) gains ground for the third successive day, trading around $92.90 per barrel during the Asian hours on Wednesday.
Related Instrument
goTop
quote