


GBP/USD slips below 1.30 as traders brace for FOMC’s decision
- GBP/USD drops 0.20% to 1.2971, retreating from a daily high above 1.30 as the US Dollar strengthens.
- Markets price in 57 bps of Fed rate cuts, but Trump’s trade policies could delay the easing cycle.
- BoE expected to hold rates at 4.5%, while UK labor data remains in focus for future monetary policy shifts.
The Pound Sterling dropped 0.20% against the Greenback during the North American session as traders await the Federal Reserve's monetary policy decision. Investors are also looking for an update on economic projections, which could lay the blueprint for what the Fed might do in the upcoming months. The GBP/USD trades at 1.2971 after hitting a daily high above 1.30.
Greenback strength and Fed uncertainty weigh on Sterling ahead of key policy updates
Market mood is mixed, with US equities trading in the green while European ones are not doing so well. The US economic schedule is absent, and market players are awaiting the Fed’s decision at 18:00 GMT.
Traders had priced the Fed to ease policy by 57 basis points (bps) throughout the year. Nevertheless, President Donald Trump's inflation-prone US trade policies could prevent the US Central Bank from continuing its cutting rates cycle and waiting to assess the impact on the economy.
So far, an Atlanta Fed model updated on March 18 shows that the Gross Domestic Product (GDP) is expected to contract -1.8% in QQ 2025.
Aside from this, the recovery of the Greenback halted Cable’s gains above 1.30. As of writing, the US Dollar Index (DXY), which tracks the buck’s performance versus a basket of six other currencies, posted gains of 0.40%, up at 103.65.
Across the pond, UK labor market data will be cautiously dissected by market players ahead of the Bank of England (BoE) monetary policy decision. The BoE is expected to hold rates at 4.5%, according to money market futures data.
GBP/USD Price Chart: Technical outlook
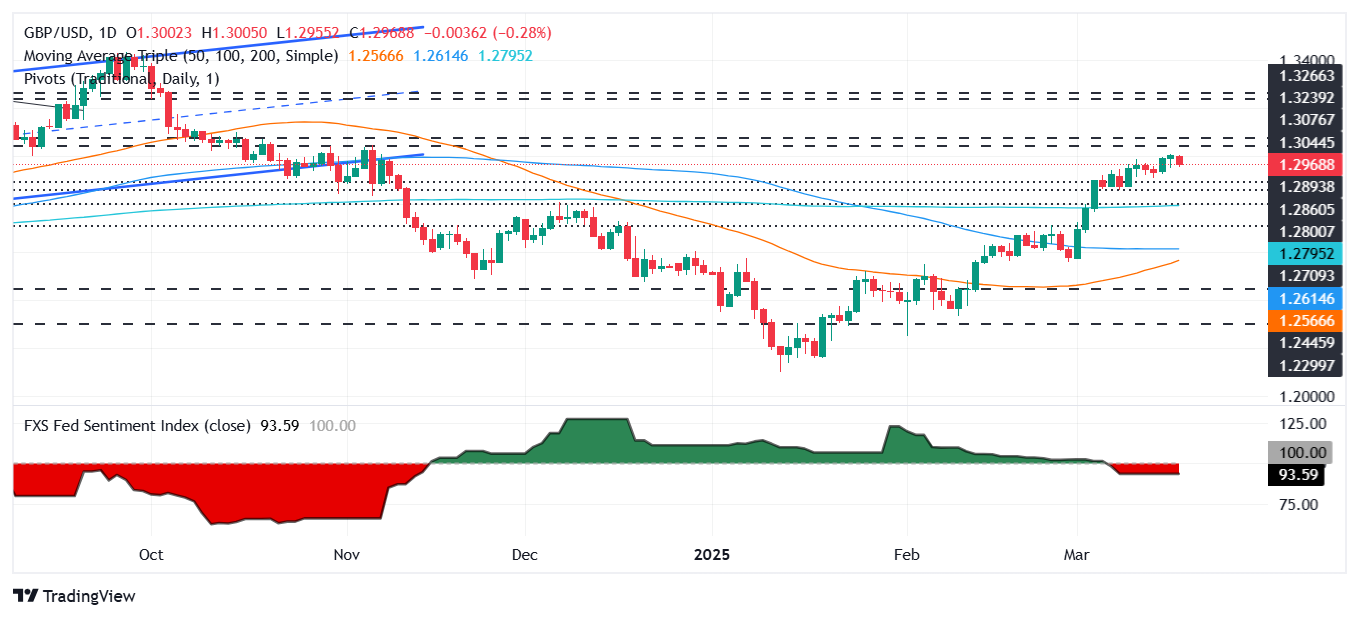
GBP/USD continued to trend up steadily, with no volatile movements so far, as traders await the Fed’s decision. On the upside, key resistance levels lie at 1.3009, the current year-to-date (YTD) peak, followed by November’s 6 high at 1.3047 and 1.31. Momentum shows that neither buyers nor sellers are in charge, as depicted by a flat Relative Strength Index (RSI) near overbought territory.
Conversely, the pair could extend its losses toward 1.2911, the March 17 swing low, ahead of the 200-day Simple Moving Average (SMA) at 1.2795.
British Pound PRICE Today
The table below shows the percentage change of British Pound (GBP) against listed major currencies today. British Pound was the strongest against the New Zealand Dollar.
| USD | EUR | GBP | JPY | CAD | AUD | NZD | CHF | |
|---|---|---|---|---|---|---|---|---|
| USD | 0.55% | 0.28% | 0.39% | 0.17% | 0.44% | 0.58% | 0.42% | |
| EUR | -0.55% | -0.28% | -0.18% | -0.38% | -0.10% | 0.03% | -0.13% | |
| GBP | -0.28% | 0.28% | 0.10% | -0.10% | 0.18% | 0.30% | 0.13% | |
| JPY | -0.39% | 0.18% | -0.10% | -0.23% | 0.05% | 0.16% | 0.02% | |
| CAD | -0.17% | 0.38% | 0.10% | 0.23% | 0.29% | 0.43% | 0.23% | |
| AUD | -0.44% | 0.10% | -0.18% | -0.05% | -0.29% | 0.12% | -0.00% | |
| NZD | -0.58% | -0.03% | -0.30% | -0.16% | -0.43% | -0.12% | -0.17% | |
| CHF | -0.42% | 0.13% | -0.13% | -0.02% | -0.23% | 0.00% | 0.17% |
The heat map shows percentage changes of major currencies against each other. The base currency is picked from the left column, while the quote currency is picked from the top row. For example, if you pick the British Pound from the left column and move along the horizontal line to the US Dollar, the percentage change displayed in the box will represent GBP (base)/USD (quote).
Recommended Articles


