AUD/JPY price analysis: Bulls hold their ground, near-term pullback signalled

Source Fxstreet
  • The AUD/JPY trades on gains at 98.33 in Wednesday's session.
  • Daily RSI for AUD/JPY suggests bullish momentum with a rising tendency and positive MACD.
  • Hourly chart signals possible short-term bearish correction in a bullish bias.
  • AUDJPY operating above key SMAs indicates long-term bullish sentiment.

In Wednesday's session, the AUD/JPY pair was spotted making moderate gains, trading at the 98.33 level. The technical landscape exhibits a generally bullish sentiment, boosted by positive momentum in the daily Relative Strength Index (RSI) RSI and Moving Average Convergence Divergence (MACD) histogram. However, a contrasting short-term bearish bias can be glimpsed on the hourly charts, suggesting possible corrective phases. Despite this, the prevailing upward drive exemplified by the pair's position above key SMAs aligns the broader perspective with the bulls.

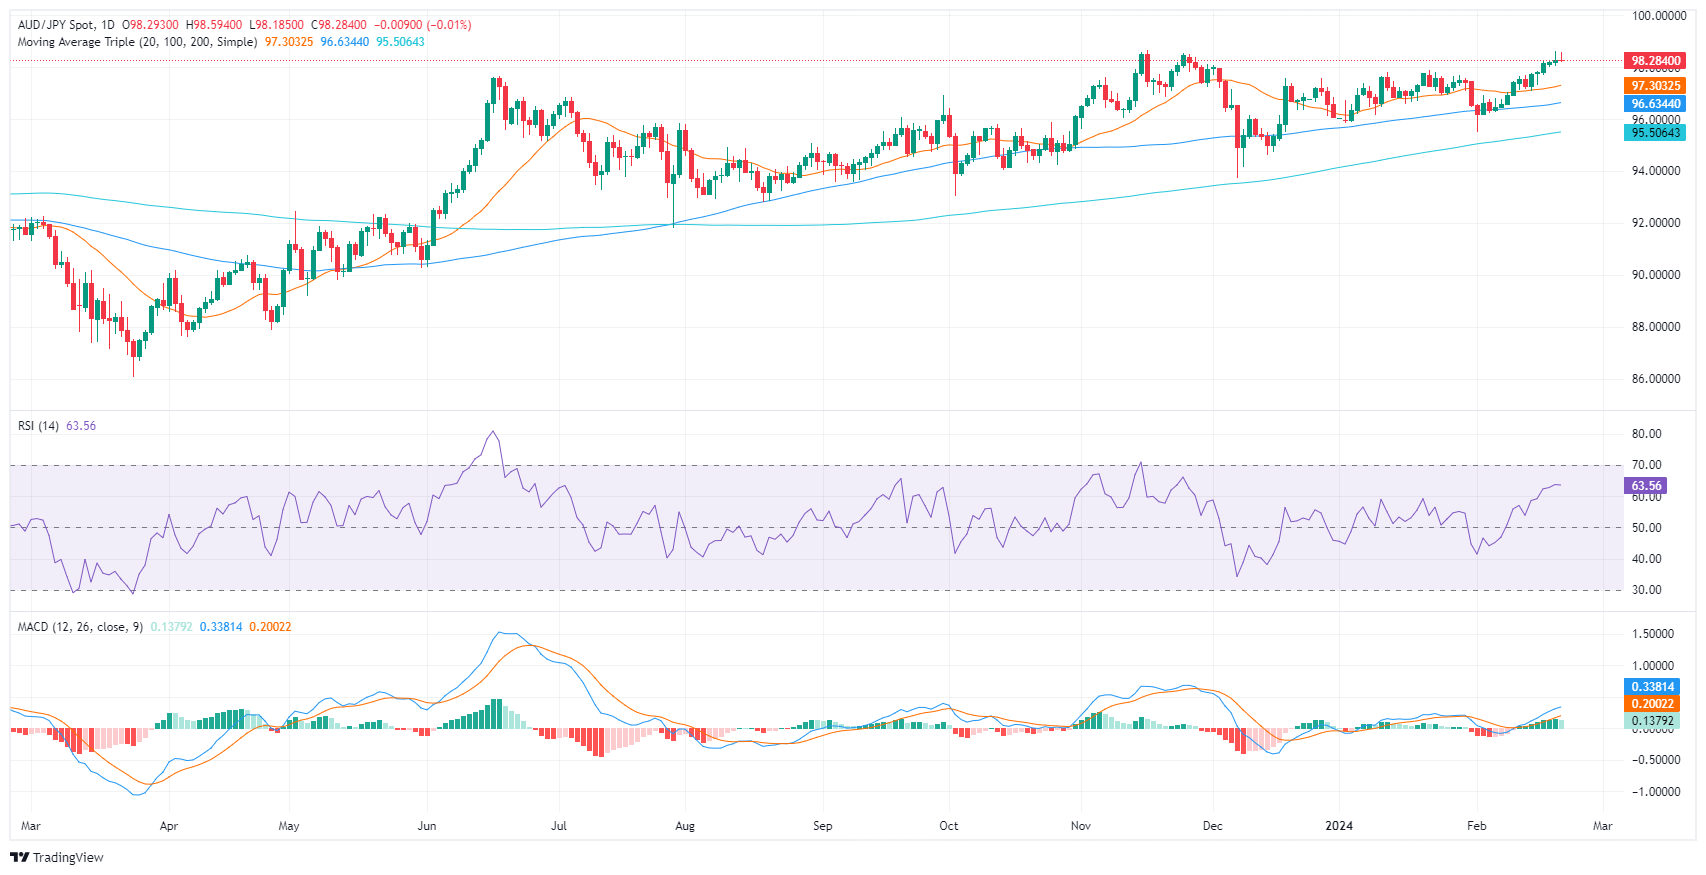
The daily RSI for the AUDJPY pair hovers in the positive territory with a rising tendency indicating growing bullish momentum in the market. Meanwhile, the MACD histogram prints green bars, signifying positive momentum, and presents an incline that confirms the increasingly bullish sentiment.

AUD/JPY daily chart

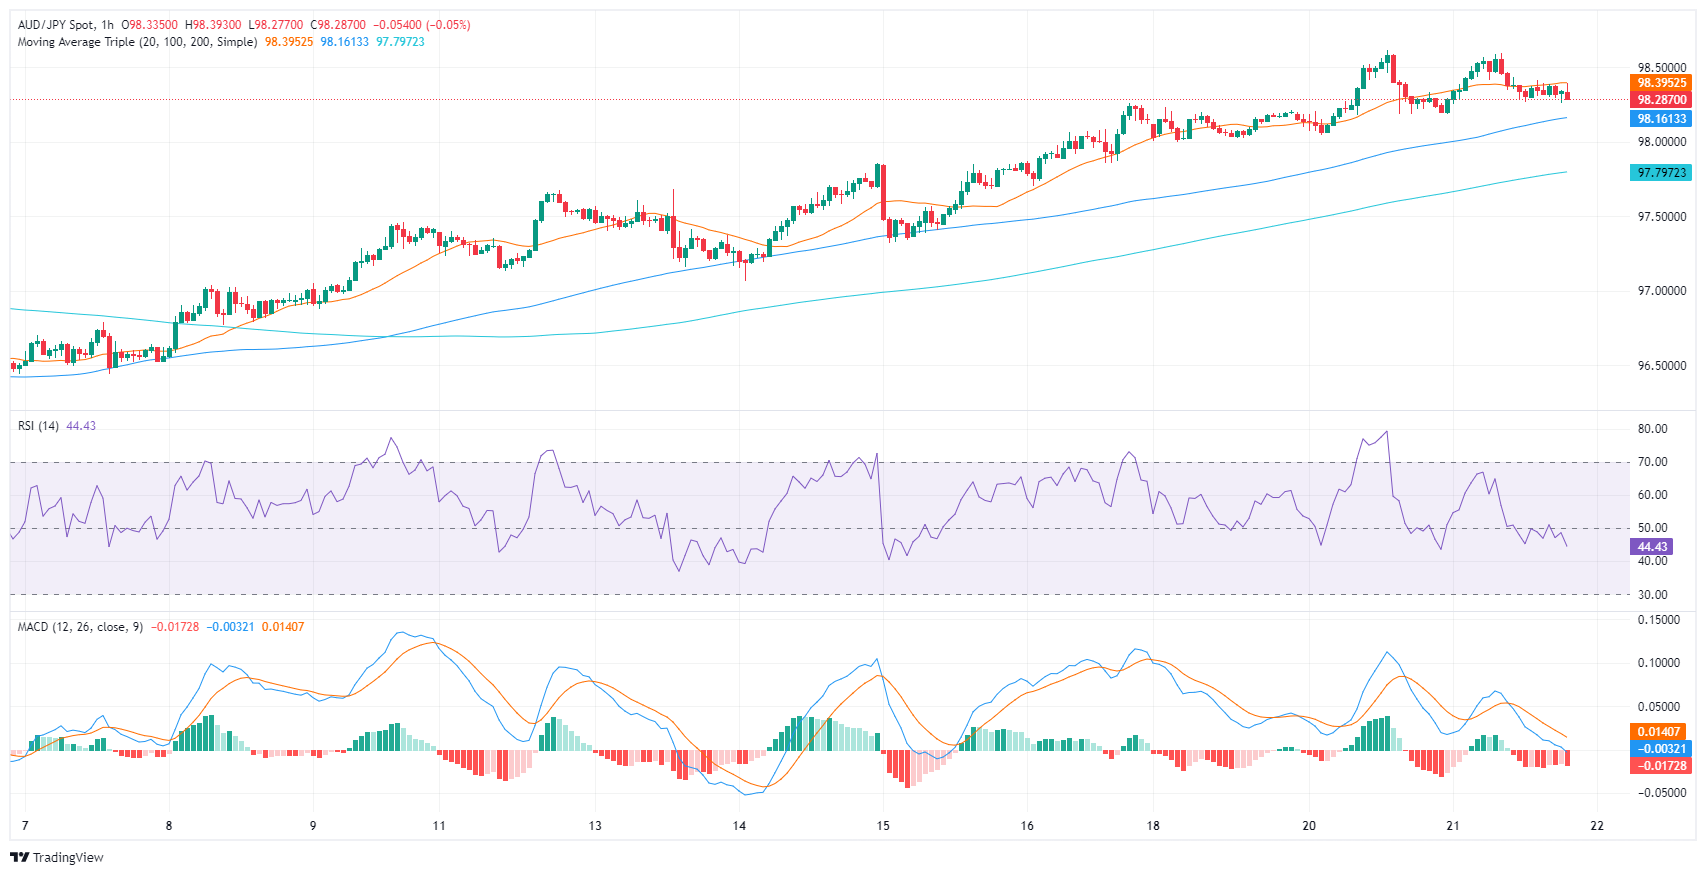
Switching to the hourly perspective, the RSI trends lower into the negative territory. This divergence in the RSI values on the daily and hourly charts could hint at a near-term corrective bearish phase within the dominant bullish bias. The MACD histogram here is currently falling, producing red bars, suggesting a slightly stronger negative momentum in the vicinity.


AUD/JPY hourly chart

However, on a broader outlook, with the AUD/JPY operating above its primary SMAs (20, 100, 200-day), indicates the long-term sentiment favors the bulls. Thus, any short-term weakness might be perceived as a healthy technical correction.


Disclaimer: For information purposes only. Past performance is not indicative of future results.
placeholder
Bulls Rout. Bitcoin Slumps Over 16% in a Week to Hit Bottom, Cryptocurrency Market Faces "Serial Liquidations"During the Asian trading session on June 5, Bitcoin extended its recent slump, falling more than 3.5% within 24 hours. It briefly broke below $62,000, hitting a low of $61,100, bringing i
Author  TradingKey
10 hours ago
During the Asian trading session on June 5, Bitcoin extended its recent slump, falling more than 3.5% within 24 hours. It briefly broke below $62,000, hitting a low of $61,100, bringing i
placeholder
Gold declines below $4,500 on stalled US-Iran ceasefire talks, US NFP data loomsGold price (XAU/USD) edges lower to near $4,470 during the early Asian session on Friday. The precious metal remains volatile amid ongoing geopolitical turmoil. Traders will closely monitor the developments surrounding the US-Iran peace deal and the US May employment report later on Friday. 
Author  FXStreet
18 hours ago
Gold price (XAU/USD) edges lower to near $4,470 during the early Asian session on Friday. The precious metal remains volatile amid ongoing geopolitical turmoil. Traders will closely monitor the developments surrounding the US-Iran peace deal and the US May employment report later on Friday. 
placeholder
Bitcoin Suffers Year’s Strongest Waterfall-Style Decline. Will It Next Drop to the $60,000 Mark?During the Asian trading session on June 4, Bitcoin continued its multi-day slump, briefly dropping below the $62,000 mark to $61,338. As of press time, Bitcoin was trading at $63,844, wi
Author  TradingKey
Yesterday 10: 07
During the Asian trading session on June 4, Bitcoin continued its multi-day slump, briefly dropping below the $62,000 mark to $61,338. As of press time, Bitcoin was trading at $63,844, wi
placeholder
Bitcoin drops below $65K amid reinforced bear market signalsBitcoin (BTC) dipped further below $65,000 on Wednesday, with onchain data from Glassnode signaling a market firmly in a bear phase. The decline has pushed prices back into a key valuation range between the Realized Price and the True Market Mean.
Author  FXStreet
Yesterday 01: 32
Bitcoin (BTC) dipped further below $65,000 on Wednesday, with onchain data from Glassnode signaling a market firmly in a bear phase. The decline has pushed prices back into a key valuation range between the Realized Price and the True Market Mean.
placeholder
Forex Today: US Dollar stays resilient ahead of key US dataHere is what you need to know on Wednesday, June 3:
Author  FXStreet
Jun 03, Wed
Here is what you need to know on Wednesday, June 3:
Related Instrument
goTop
quote