EUR/USD Price Analysis: Rises to near 1.0810 followed by the barrier at 50-day EMA

Source Fxstreet
  • EUR/USD could test the resistance zone around the 50-day EMA and a three-week high.
  • A break above the major level of 1.0850 could lead the pair to reach a 38.2% Fibonacci retracement at 1.0864.
  • Technical indicators suggest a momentum shift towards an upward direction.

EUR/USD continues its winning streak that began on February 14 as the US Dollar (USD) receives downward pressure, which in turn, underpins the EUR/USD pair. The pair edges higher around 1.0810 during the Asian session on Wednesday.

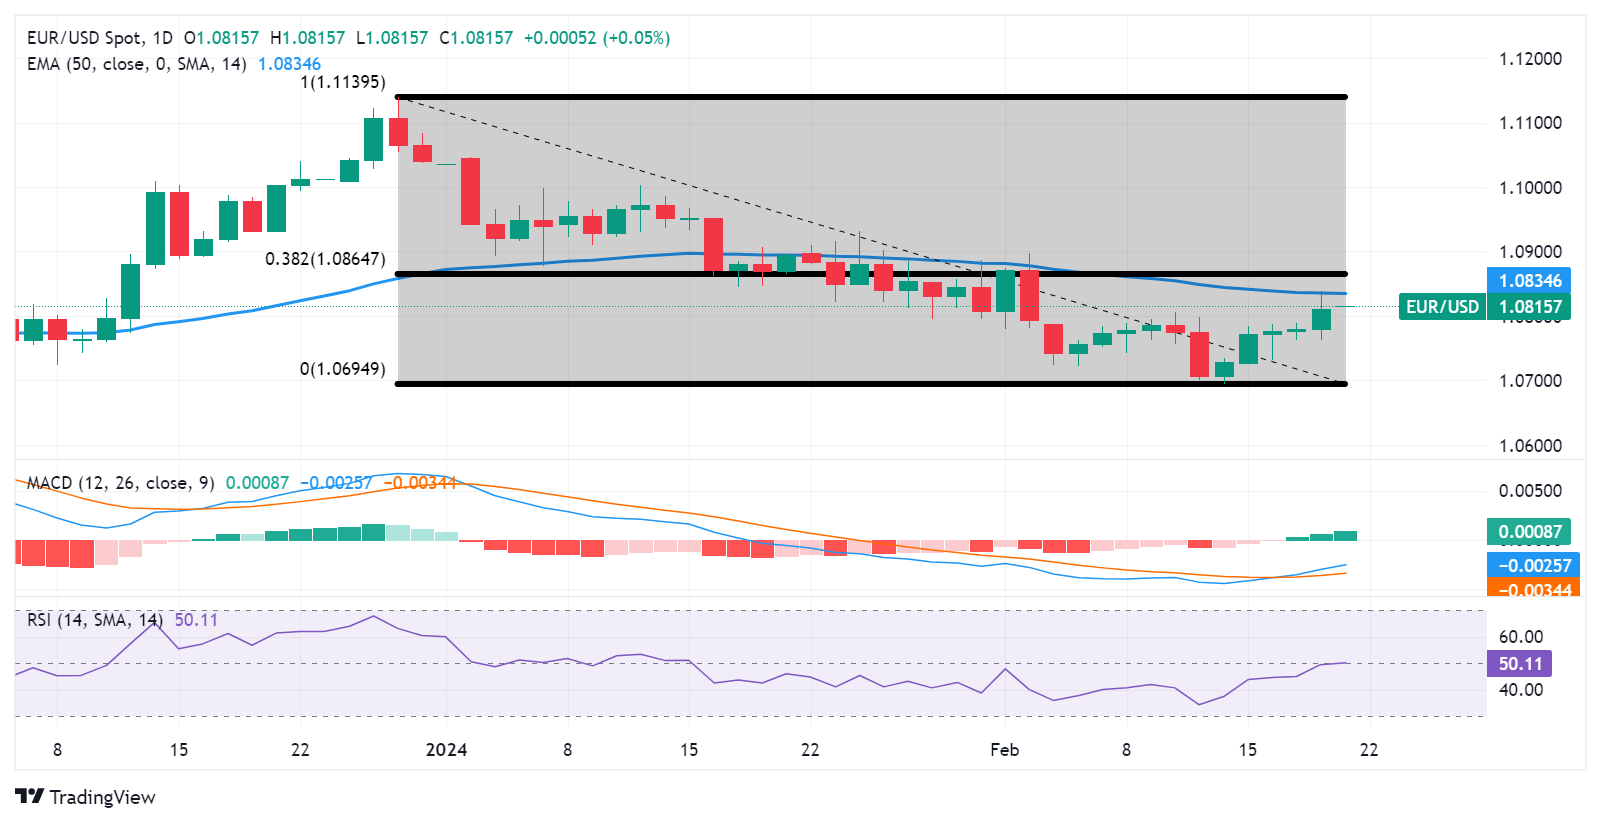
The EUR/USD pair could rise to test the immediate resistance zone around the 50-day Exponential Moving Average (EMA) at 1.0834 and the three-week high at 1.0838. A breakthrough above this zone could exert upward support for the pair to reach the major support at 1.0850 followed by the 38.2% Fibonacci retracement level at 1.0864.

The technical analysis of the EUR/USD pair indicates a potential shift towards upward momentum. While the 14-day Relative Strength Index (RSI) sits at the 50 mark, signaling a neutral stance, the Moving Average Convergence Divergence (MACD) lies below the centreline but shows a divergence above the signal line. Traders may await further confirmation from the MACD to determine a clear directional trend.

On the downside, the immediate support appears at the psychological level at 1.0800 followed by the recent low at 1.0761 recorded on Tuesday. A break below the latter could put downward pressure on the EUR/USD pair to navigate the major support level of 1.0750 with an aim to approach the psychological support at 1.0700.

EUR/USD: Daily Chart
 

Disclaimer: For information purposes only. Past performance is not indicative of future results.
placeholder
Natural Gas sinks to pivotal level as China’s demand slumpsNatural Gas price (XNG/USD) edges lower and sinks to $2.56 on Monday, extending its losing streak for the fifth day in a row. The move comes on the back of China cutting its Liquified Natural Gas (LNG) imports after prices rose above $3.0 in June. It
Author  FXStreet
Jul 01, 2024
Natural Gas price (XNG/USD) edges lower and sinks to $2.56 on Monday, extending its losing streak for the fifth day in a row. The move comes on the back of China cutting its Liquified Natural Gas (LNG) imports after prices rose above $3.0 in June. It
placeholder
Bitcoin ETF Inflows For 2025 Now Outpace 2024, Data ShowsUS Bitcoin spot exchange-traded funds (ETFs) have seen more inflows this year so far compared to the same point in 2024, according to data.
Author  Bitcoinist
Jul 16, Wed
US Bitcoin spot exchange-traded funds (ETFs) have seen more inflows this year so far compared to the same point in 2024, according to data.
placeholder
Gold Price Forecast: XAU/USD gains momentum to near $3,650, eyes on US CPI releaseThe Gold price (XAU/USD) gains momentum to near $3,645 during the early Asian session on Thursday.
Author  FXStreet
Sep 11, Thu
The Gold price (XAU/USD) gains momentum to near $3,645 during the early Asian session on Thursday.
placeholder
Silver price moves above $47.50 as safe-haven demand increasesSilver price (XAG/USD) halts its three-day losing streak, trading around $47.60 per troy ounce during the Asian hours on Wednesday.
Author  FXStreet
Yesterday 07: 04
Silver price (XAG/USD) halts its three-day losing streak, trading around $47.60 per troy ounce during the Asian hours on Wednesday.
placeholder
Dogecoin Price Forecast: DOGE steadies amid declining retail interest, bearish on-chain signalsBoth the on-chain and derivatives data suggest weak sentiment among retail and long-term holders.
Author  FXStreet
Yesterday 09: 39
Both the on-chain and derivatives data suggest weak sentiment among retail and long-term holders.
Related Instrument
goTop
quote