NZD/USD Price Analysis: Trades near 0.6170, advances towards a barrier at 38.2% Fibonacci

Source Fxstreet
  • NZD/USD could surpass the resistance level of 38.2% Fibonacci retracement at 0.6179.
  • A break above the 0.6200 could prompt the pair test 50.0% retracement level of 0.6223.
  • The pair could meet the support at the nine-day EMA at 0.6124
  • Technical analysis suggests a momentum shift towards an upward direction.

NZD/USD continues to move on an upward trajectory for the fifth successive session on Tuesday as the US Dollar (USD) trims daily gains to extend its losses. The NZD/USD pair surges to near 0.6170 during the European trading hours.

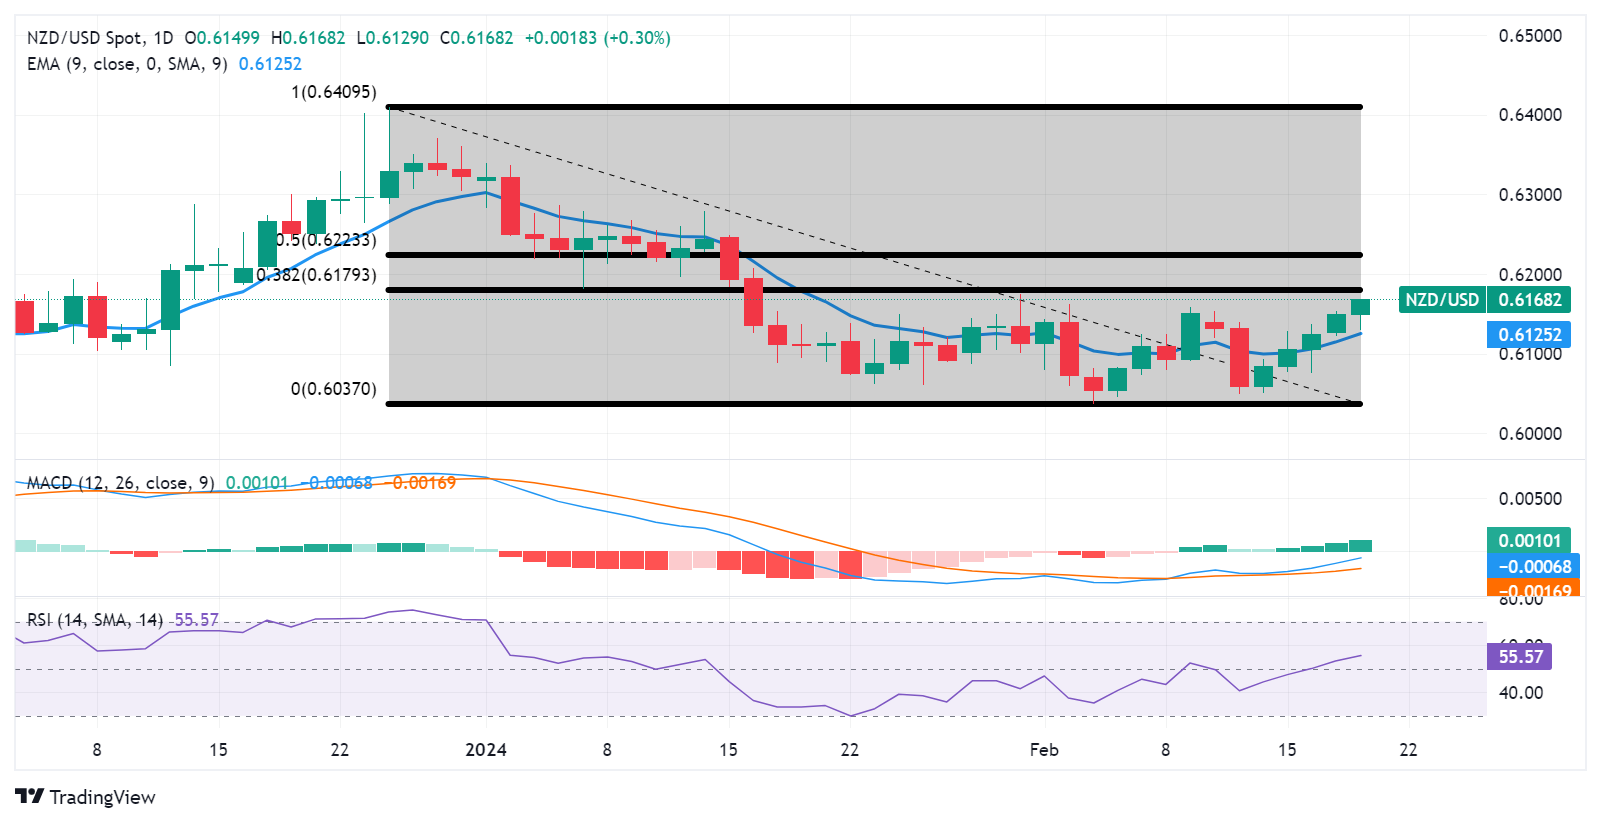
The NZD/USD pair could find immediate resistance around the 38.2% Fibonacci retracement at 0.6179 followed by the psychological resistance level of 0.6200. A firm break above this psychological barrier could exert upward support for the pair to explore the region around the 50.0% retracement level of 0.6223.

The technical analysis of the NZD/USD pair suggests a momentum shift towards upward direction. The Moving Average Convergence Divergence (MACD) line is situated below the centerline but shows divergence above the signal line.

Furthermore, the lagging indicator 14-day Relative Strength Index (RSI) lies above the 50 level, suggesting a bullish sentiment for the NZD/USD pair.

On the downside, the NZD/USD pair could find immediate support at the major level of 0.6150. A break below the latter could put the downward pressure on the NZD/USD pair to test the nine-day Exponential Moving Average (EMA) at 0.6124 to approach the psychological level of 0.6100.

NZD/USD: Daily Chart


Disclaimer: For information purposes only. Past performance is not indicative of future results.
placeholder
WTI Crude Oil Price Forecast: Trump Says US-Iran Talks Progressing Smoothly, Oil May Fall Below $60 As of the European session on July 2, WTI ( USOIL) crude oil prices fluctuated with a weak bias around $68, extending their prior downward trend. From a technical perspective, against the
Author  TradingKey
8 hours ago
As of the European session on July 2, WTI ( USOIL) crude oil prices fluctuated with a weak bias around $68, extending their prior downward trend. From a technical perspective, against the
placeholder
Japanese Yen recovers sharply from 40-year low as intervention bets trigger short-coveringThe USD/JPY pair comes under intense selling pressure and plummets to the 161.00 neighborhood heading into the European session on Thursday, snapping a three-day winning streak to the highest since 1986 set the previous day.
Author  FXStreet
10 hours ago
The USD/JPY pair comes under intense selling pressure and plummets to the 161.00 neighborhood heading into the European session on Thursday, snapping a three-day winning streak to the highest since 1986 set the previous day.
placeholder
Fed Chair Warsh Says Inflation Risks Are Receding, Sending Gold Rebounding by Nearly $100On Wednesday (July 1), Eastern Time, Federal Reserve Chairman Warsh stated at the ECB's annual forum in Sintra, Portugal, that while recent US inflation expectations and inflation risks h
Author  TradingKey
15 hours ago
On Wednesday (July 1), Eastern Time, Federal Reserve Chairman Warsh stated at the ECB's annual forum in Sintra, Portugal, that while recent US inflation expectations and inflation risks h
placeholder
WTI slips below $68.00 as supply concerns easeWest Texas Intermediate (WTI) oil price loses ground for the third successive day, trading around $67.80 per barrel during the Asian hours on Thursday. The global energy market experiences a sharp downturn, with crude oil benchmarks sliding significantly as supply anxieties ease.
Author  FXStreet
17 hours ago
West Texas Intermediate (WTI) oil price loses ground for the third successive day, trading around $67.80 per barrel during the Asian hours on Thursday. The global energy market experiences a sharp downturn, with crude oil benchmarks sliding significantly as supply anxieties ease.
placeholder
Bitcoin Price Trend Forecast: Continued ETF Outflows Limit Bitcoin Price Rebound Space, $58,000 Becomes Key Level for Bulls and Bears As of the European trading session on July 1, Bitcoin ( BTC) fluctuated around $58,700, hitting a new year-to-date low of $57,800 earlier in the day before recovering slightly, though it
Author  TradingKey
Yesterday 10: 23
As of the European trading session on July 1, Bitcoin ( BTC) fluctuated around $58,700, hitting a new year-to-date low of $57,800 earlier in the day before recovering slightly, though it
Related Instrument
goTop
quote