AUD/JPY Price Analysis: Bears take control as pair slips below 20-day SMA

Source Fxstreet
  • AUD/JPY declines by 0.42% to 96.30 on Monday, extending its recent losing streak.
  • RSI drops to negative territory, signaling increasing bearish pressure.
  • The breach of the 20-day SMA confirms a shift in sentiment, putting sellers in control.

AUD/JPY continued its downward movement on Monday, losing 0.42% to settle around 96.30. The break below the 20-day Simple Moving Average (SMA) reinforces the weakening trend, as buyers struggle to regain momentum. The pair has now given up most of its recent gains, with sellers gaining traction.

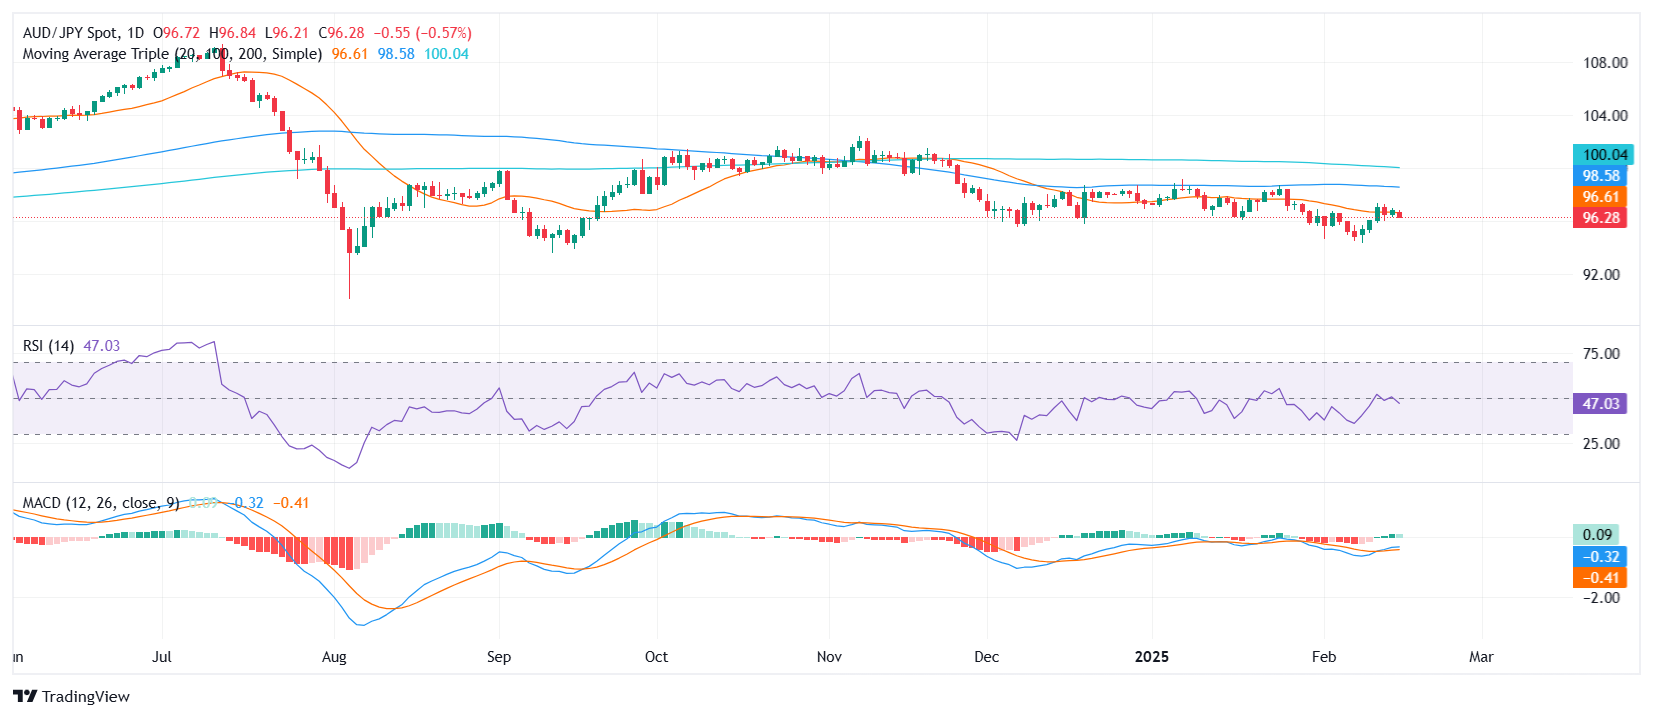
Momentum indicators paint a bearish picture. The Relative Strength Index (RSI) has fallen sharply to 48, reflecting increased downside pressure, while the Moving Average Convergence Divergence (MACD) histogram shows decreasing green bars, suggesting that bullish attempts are fading. The pair’s inability to hold above the 20-day SMA indicates that selling momentum could intensify.

If the downward trend persists, the next key support lies around 96.00, followed by 95.50. On the upside, buyers would need to push AUD/JPY back above the 20-day SMA near 96.60 to regain short-term control and shift sentiment toward a more neutral stance.

AUD/JPY daily chart

Disclaimer: For information purposes only. Past performance is not indicative of future results.
placeholder
Nvidia Q1 Revenue Surges 85%, Data Center Business Accounts for 90%, Blowout Results Fail to Stop Stock VolatilityAs the absolute leader in the global AI industry chain, NVIDIA ( NVDA) delivered a quarterly earnings report that surpassed Wall Street's general expectations as anticipated.After the mar
Author  TradingKey
9 hours ago
As the absolute leader in the global AI industry chain, NVIDIA ( NVDA) delivered a quarterly earnings report that surpassed Wall Street's general expectations as anticipated.After the mar
placeholder
Is US-Iran Conflict About to End? Crude Oil Plummets, Gold Hits $4,500Tensions between the US and Iran showed clear signs of easing on Wednesday (May 20), leading to a plunge in the crude oil market while gold ( XAUUSD) continued its rally.WTI crude oil dai
Author  TradingKey
13 hours ago
Tensions between the US and Iran showed clear signs of easing on Wednesday (May 20), leading to a plunge in the crude oil market while gold ( XAUUSD) continued its rally.WTI crude oil dai
placeholder
Gold holds steady near $4,550 as market eyes Middle East developmentsGold price (XAU/USD) trades on a flat note around $4,540 during the early Asian session on Thursday. Traders continue to assess the developments surrounding stalled US-Iran peace negotiations and threats to the Strait of Hormuz.
Author  FXStreet
17 hours ago
Gold price (XAU/USD) trades on a flat note around $4,540 during the early Asian session on Thursday. Traders continue to assess the developments surrounding stalled US-Iran peace negotiations and threats to the Strait of Hormuz.
placeholder
Nvidia Earnings Approach: Can It Drive a Nasdaq Rebound? What Should Investors Watch Most?On May 20, ET, NVIDIA ( NVDA )'s first-quarter fiscal 2026 earnings report, to be released after the market close, has become the market focus. The options market has already reacted; bas
Author  TradingKey
Yesterday 10: 33
On May 20, ET, NVIDIA ( NVDA )'s first-quarter fiscal 2026 earnings report, to be released after the market close, has become the market focus. The options market has already reacted; bas
placeholder
Gold Prices Fall Below Key $4,500 Mark, US Treasury Yields Rise for Seventh Day, Gold May Fall to $4,100On Tuesday (May 19), gold ( XAUUSD) closed at $4,481.89. The price confirmed a break below $4,500, further opening up the downside. On Wednesday, gold extended its downward trend from the
Author  TradingKey
Yesterday 03: 34
On Tuesday (May 19), gold ( XAUUSD) closed at $4,481.89. The price confirmed a break below $4,500, further opening up the downside. On Wednesday, gold extended its downward trend from the
Related Instrument
goTop
quote