EUR/USD Price Analysis: Bulls pause as pair retreats toward 20-day SMA

Source Fxstreet
  • EUR/USD drops on Thursday, slipping to 1.0355 after recent gains.
  • After rising above the 20-day SMA earlier in the week, the pair faces renewed selling pressure and sellers might test its strength.
  • A loss would push the pair towards 1.0300.

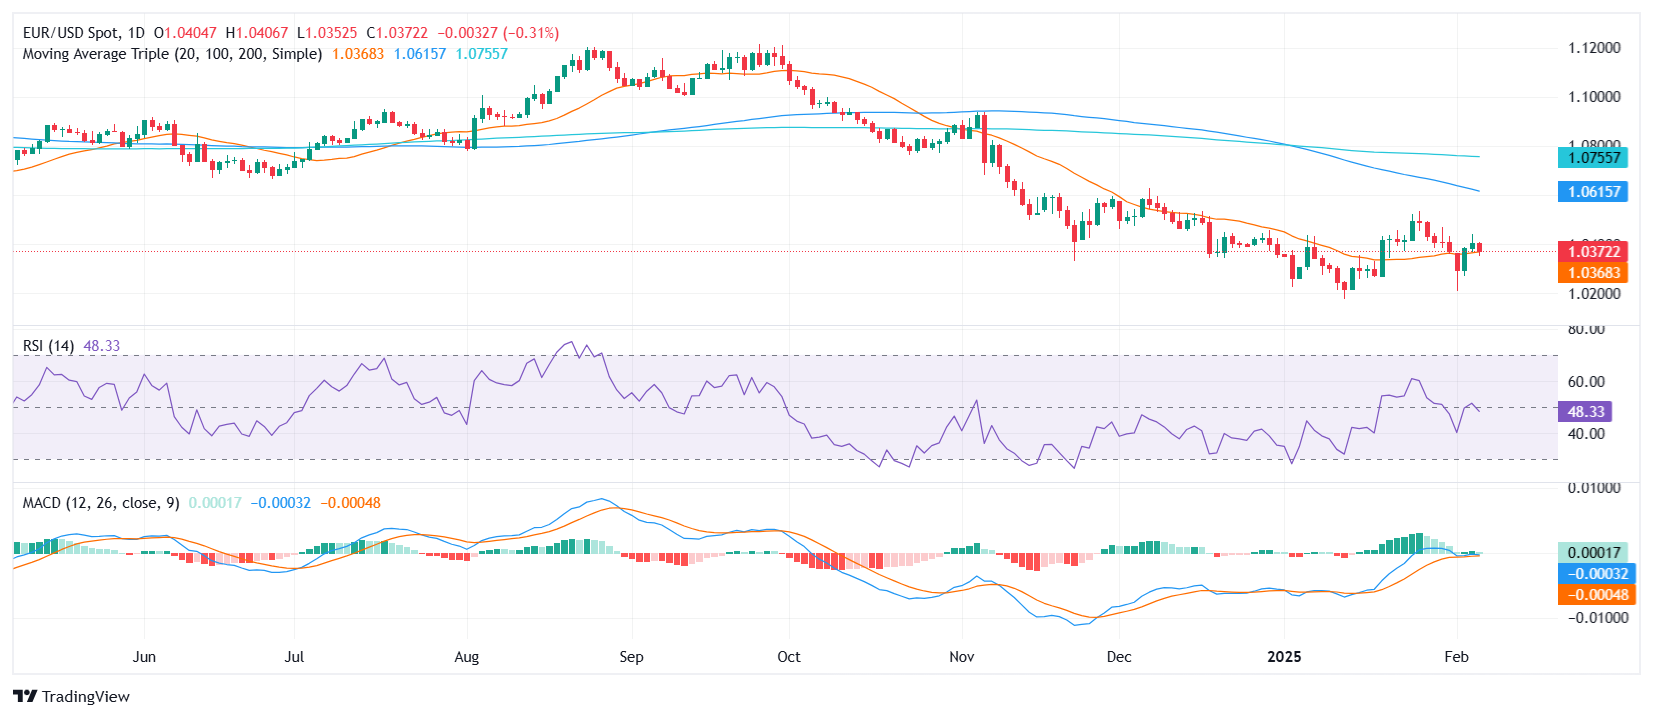
The EUR/USD pair pulled back on Thursday, declining by 0.45% to 1.0370 as bullish momentum faded. After climbing above the 20-day Simple Moving Average (SMA) at the start of the week, the pair now faces renewed bearish pressure, with sellers attempting to push it back toward this key support level. However, the overall outlook remains bearish with the pair well below the 100 and 200-day SMA which stand around 1.0600 and 1.0700.

Technical indicators suggest a weakening in bullish traction. The Relative Strength Index (RSI) has sharply declined to 49, moving into negative territory, signaling that upside momentum is losing steam. Meanwhile, the Moving Average Convergence Divergence (MACD) histogram remains flat with green bars, indicating indecisiveness in market sentiment.

If selling pressure persists, EUR/USD could test the 20-day SMA, currently near 1.0360. A break below this level would open the door for further declines toward 1.0300. On the other hand, if buyers regain control, resistance lies at 1.0400, followed by the key 1.0450 zone. For now, the short-term outlook hinges on whether the pair can hold above its 20-day SMA.

EUR/USD daily chart

Disclaimer: For information purposes only. Past performance is not indicative of future results.
placeholder
Bitcoin Suffers Year’s Strongest Waterfall-Style Decline. Will It Next Drop to the $60,000 Mark?During the Asian trading session on June 4, Bitcoin continued its multi-day slump, briefly dropping below the $62,000 mark to $61,338. As of press time, Bitcoin was trading at $63,844, wi
Author  TradingKey
8 hours ago
During the Asian trading session on June 4, Bitcoin continued its multi-day slump, briefly dropping below the $62,000 mark to $61,338. As of press time, Bitcoin was trading at $63,844, wi
placeholder
Bitcoin drops below $65K amid reinforced bear market signalsBitcoin (BTC) dipped further below $65,000 on Wednesday, with onchain data from Glassnode signaling a market firmly in a bear phase. The decline has pushed prices back into a key valuation range between the Realized Price and the True Market Mean.
Author  FXStreet
16 hours ago
Bitcoin (BTC) dipped further below $65,000 on Wednesday, with onchain data from Glassnode signaling a market firmly in a bear phase. The decline has pushed prices back into a key valuation range between the Realized Price and the True Market Mean.
placeholder
Forex Today: US Dollar stays resilient ahead of key US dataHere is what you need to know on Wednesday, June 3:
Author  FXStreet
Yesterday 10: 27
Here is what you need to know on Wednesday, June 3:
placeholder
$1.5 Billion in Crypto Assets Liquidated, Bitcoin Falls Below $66,000 Mark. What Is the Reason?On June 2, Eastern Time, the cryptocurrency market suffered its most severe wave of concentrated liquidations so far this year. Bitcoin ( BTC) fell below the $70,000 psychological support
Author  TradingKey
Yesterday 06: 32
On June 2, Eastern Time, the cryptocurrency market suffered its most severe wave of concentrated liquidations so far this year. Bitcoin ( BTC) fell below the $70,000 psychological support
placeholder
WTI rises to near $93.00 as Iran launches missiles toward Kuwait, BahrainWest Texas Intermediate (WTI) gains ground for the third successive day, trading around $92.90 per barrel during the Asian hours on Wednesday.
Author  FXStreet
Yesterday 01: 24
West Texas Intermediate (WTI) gains ground for the third successive day, trading around $92.90 per barrel during the Asian hours on Wednesday.
Related Instrument
goTop
quote