EUR/GBP Price Analysis: Pair weakens toward critical 200-day SMA

Source Fxstreet
  • EUR/GBP edges lower to 0.8445 on Thursday, maintaining a cautious tone near key support levels.
  • Momentum wanes as the pair approaches the 200-day SMA at 0.8420.
  • Technical signals suggest limited upside unless buyers reclaim the 0.8465 resistance zone.

The EUR/GBP pair edged lower on Thursday, slipping to 0.8445 as it drifts closer to the 200-day Simple Moving Average (SMA), positioned around 0.8420. 

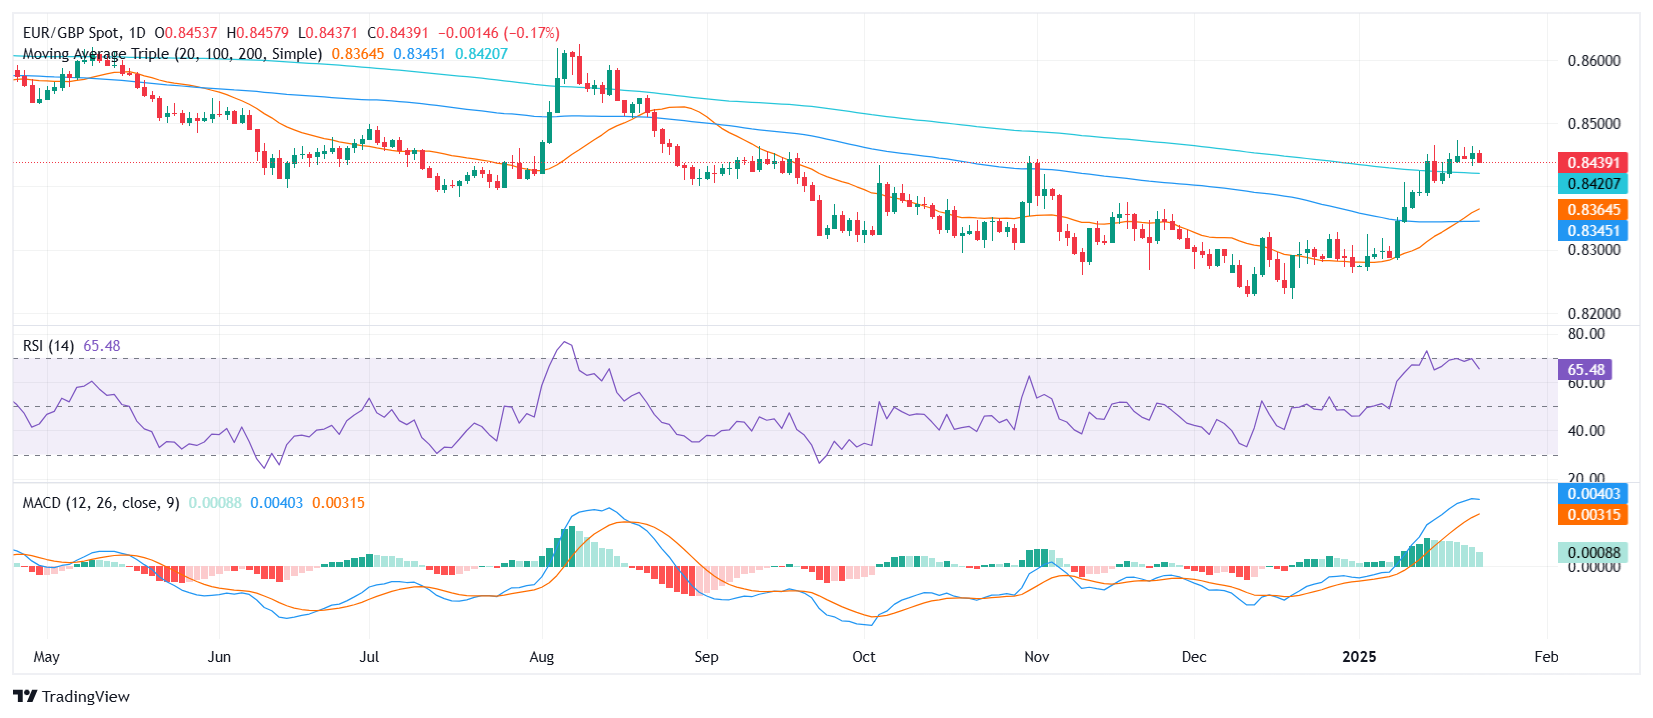
Technical indicators reflect a waning bullish bias. The Relative Strength Index (RSI) remains at 65, staying in positive territory but showing no signs of further advancement, pointing to a neutral stance. Meanwhile, the Moving Average Convergence Divergence (MACD) histogram continues to display decreasing green bars, highlighting diminishing upward pressure and raising the possibility of further downside.

In the immediate term, the 200-day SMA at 0.8420 serves as a pivotal support level; a sustained breach below this could open the door for a move toward the 0.8400 mark. On the upside, recovery efforts will need to reclaim 0.8465 to challenge the 0.8500 psychological resistance, which would mark a significant improvement in the pair’s outlook.

EUR/GBP daily chart

Disclaimer: For information purposes only. Past performance is not indicative of future results.
placeholder
$180 Oil Prices Imminent? Saudi Arabia Warns: Crisis to Last Until Late April, Oil Prices Will Break Historic HighsThe continuous escalation of geopolitical conflicts in the Middle East is pushing global energy markets toward their most severe test in nearly 20 years.The Wall Street Journal reports th
Author  TradingKey
Yesterday 10: 11
The continuous escalation of geopolitical conflicts in the Middle East is pushing global energy markets toward their most severe test in nearly 20 years.The Wall Street Journal reports th
placeholder
Gold tumbles below $4,650 as inflation fears and liquidity squeeze weighGold price (XAU/USD) remains under selling pressure near $4,640 during the early Asian session on Friday. The precious metal extends the decline as soaring crude oil and energy prices, driven by the escalating US-Israeli war with Iran, reignite inflation fears.
Author  FXStreet
Yesterday 01: 22
Gold price (XAU/USD) remains under selling pressure near $4,640 during the early Asian session on Friday. The precious metal extends the decline as soaring crude oil and energy prices, driven by the escalating US-Israeli war with Iran, reignite inflation fears.
placeholder
Bitcoin Drops Below $70,000 as Crypto Rally Fails to MaterializeThe crypto market experienced a significant pullback, Bitcoin (BTCUSD) fell below the key $70,000 mark during intraday trading, triggering short-term stop-loss orders and causing market s
Author  TradingKey
Mar 19, Thu
The crypto market experienced a significant pullback, Bitcoin (BTCUSD) fell below the key $70,000 mark during intraday trading, triggering short-term stop-loss orders and causing market s
placeholder
Gold falls below $4,850 as Fed holds rates steadyGold price (XAU/USD) faces some selling pressure near $4,830 during the early Asian session on Thursday.
Author  FXStreet
Mar 19, Thu
Gold price (XAU/USD) faces some selling pressure near $4,830 during the early Asian session on Thursday.
placeholder
WTI Crude Prices Capped at $100, Has the Rally Ended? How to Trade the Short Term? Today (March 18), WTI crude oil continued to exhibit significant short-term volatility, driven by a tug-of-war between headlines and data. Intraday, prices retreated from Tuesday's high o
Author  TradingKey
Mar 18, Wed
Today (March 18), WTI crude oil continued to exhibit significant short-term volatility, driven by a tug-of-war between headlines and data. Intraday, prices retreated from Tuesday's high o
Related Instrument
goTop
quote