NZD/USD Price Analysis: Pair struggles to find direction within range

Source Fxstreet
  • NZD/USD edges slightly lower to 0.5670 on Wednesday, maintaining its position within a narrow trading band.
  • RSI dips, showing a mild loss of momentum while staying in positive territory.

The NZD/USD pair continued its range-bound behavior on Wednesday, slipping marginally to 0.5670 after testing the upper boundary of its recent 0.5540–0.5690 consolidation zone. While the pair has experienced pockets of volatility, it has yet to establish a definitive directional bias, leaving traders cautious about committing to either side.

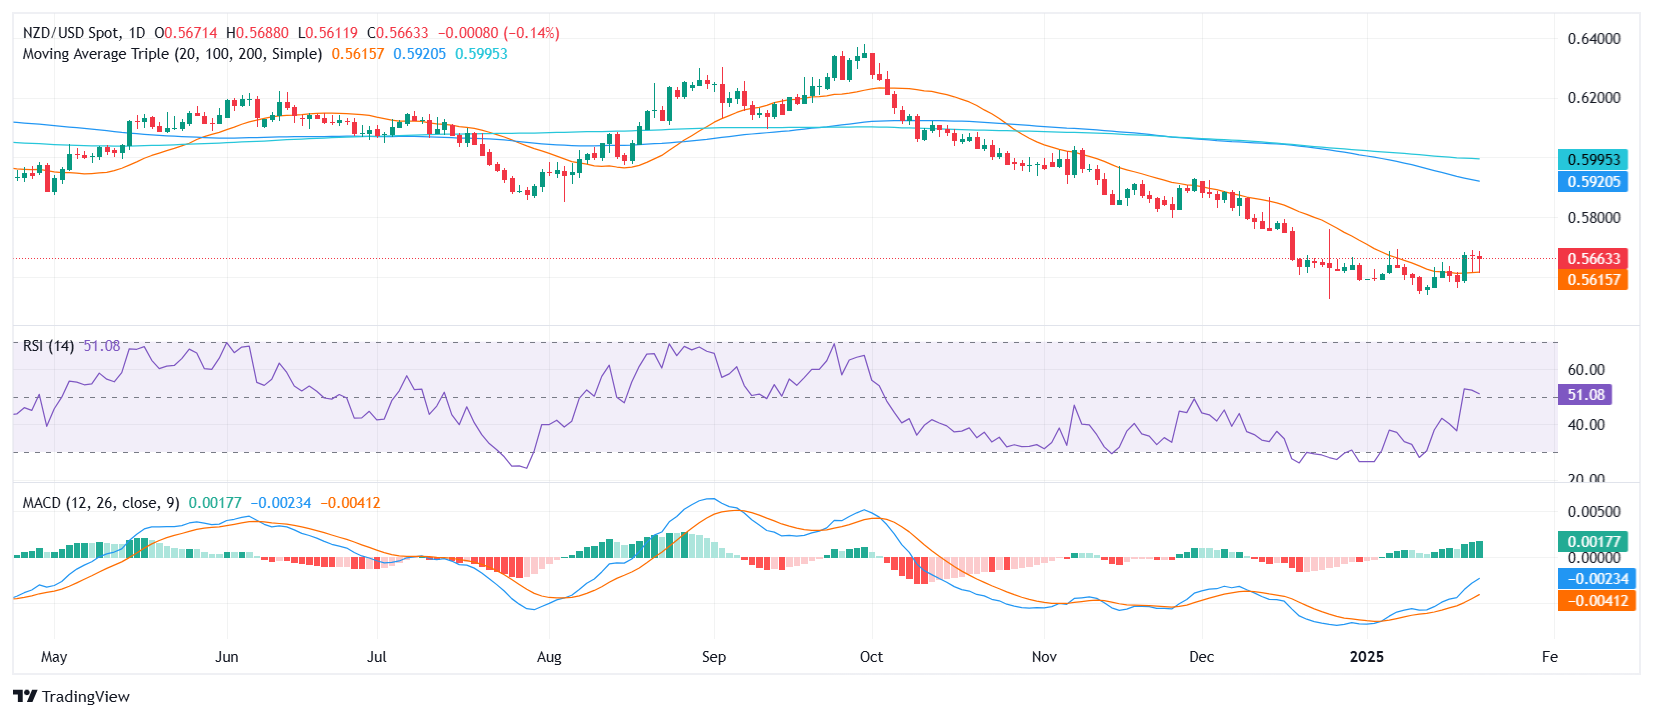
Technical indicators reflect the pair’s current state of indecision. The Relative Strength Index (RSI) has softened slightly to 51, staying within positive territory but pointing to waning bullish enthusiasm. Conversely, the Moving Average Convergence Divergence (MACD) histogram remains supportive, with rising green bars signaling a potential shift toward upward momentum if buyers can sustain their efforts.

To escape its current range, the pair would need to break decisively above the 0.5690 resistance, potentially opening the door for a move toward the 0.5730 level. On the flip side, a retreat below 0.5540 could pave the way for further downside, with 0.5500 emerging as a key support level to watch.

NZD/USD daily chart

Disclaimer: For information purposes only. Past performance is not indicative of future results.
placeholder
Yen Nears 160 Mark Again, Is Japan Intervention Imminent? As the US dollar continues to strengthen, the yen is once again approaching a key psychological level. During the Friday Asian trading session, USD/JPY (USDJPY) rose to near the 160 level
Author  TradingKey
12 hours ago
As the US dollar continues to strengthen, the yen is once again approaching a key psychological level. During the Friday Asian trading session, USD/JPY (USDJPY) rose to near the 160 level
placeholder
WTI climbs above $95.50 as Iran says the Strait of Hormuz must remain closed West Texas Intermediate (WTI), the US crude oil benchmark, is trading around $95.75 during the early Asian trading hours on Friday. The WTI price surges due to the effective closure of the Strait of Hormuz amid conflict involving the United States (US), Israel, and Iran.
Author  FXStreet
21 hours ago
 West Texas Intermediate (WTI), the US crude oil benchmark, is trading around $95.75 during the early Asian trading hours on Friday. The WTI price surges due to the effective closure of the Strait of Hormuz amid conflict involving the United States (US), Israel, and Iran.
placeholder
Goldman Sachs Raises Oil Price Forecasts and Warns Oil May Break All-Time Highs if Strait of Hormuz Disruption PersistsTradingKey - As tensions in the Middle East continue to escalate, concerns over supply disruptions in the energy market are heating up rapidly. Goldman Sachs' latest report raised its crude oil price
Author  TradingKey
Yesterday 10: 00
TradingKey - As tensions in the Middle East continue to escalate, concerns over supply disruptions in the energy market are heating up rapidly. Goldman Sachs' latest report raised its crude oil price
placeholder
SEC, CFTC move past turf battle as Bitcoin approaches $70KThe SEC and the CFTC entered into a memorandum of understanding to work together on a regulatory framework.
Author  Cryptopolitan
Yesterday 09: 59
The SEC and the CFTC entered into a memorandum of understanding to work together on a regulatory framework.
placeholder
Gold weakens as inflation concerns lift US bond yields and USD; downside remains cushionedGold (XAU/USD) trades with a negative bias for the second consecutive day on Thursday, though it lacks follow-through selling and stalls the intraday slide near the $5,125 area.
Author  FXStreet
Yesterday 06: 01
Gold (XAU/USD) trades with a negative bias for the second consecutive day on Thursday, though it lacks follow-through selling and stalls the intraday slide near the $5,125 area.
Related Instrument
goTop
quote