GBP/USD Price Forecast: Edges up, stabilizes near 1.2250

Source Fxstreet
  • Pound closes slightly below Tuesday's high, consolidating between 1.2210 and 1.2240.
  • Resistance at 1.2299; above 1.2250 could extend gains to 1.2351.
  • Break below 1.2200 may renew selling, targeting supports at 1.2136 and 1.2099.

The Pound Sterling posted modest gains on Wednesday after hit seesawing in a wide range of 1.2154 - 1.2306 during the day, yet stabilized at current exchange rates. At the time of writing, the GBP/USD trades at 1.2241, set to close below Tuesday’s high of 1.2249.

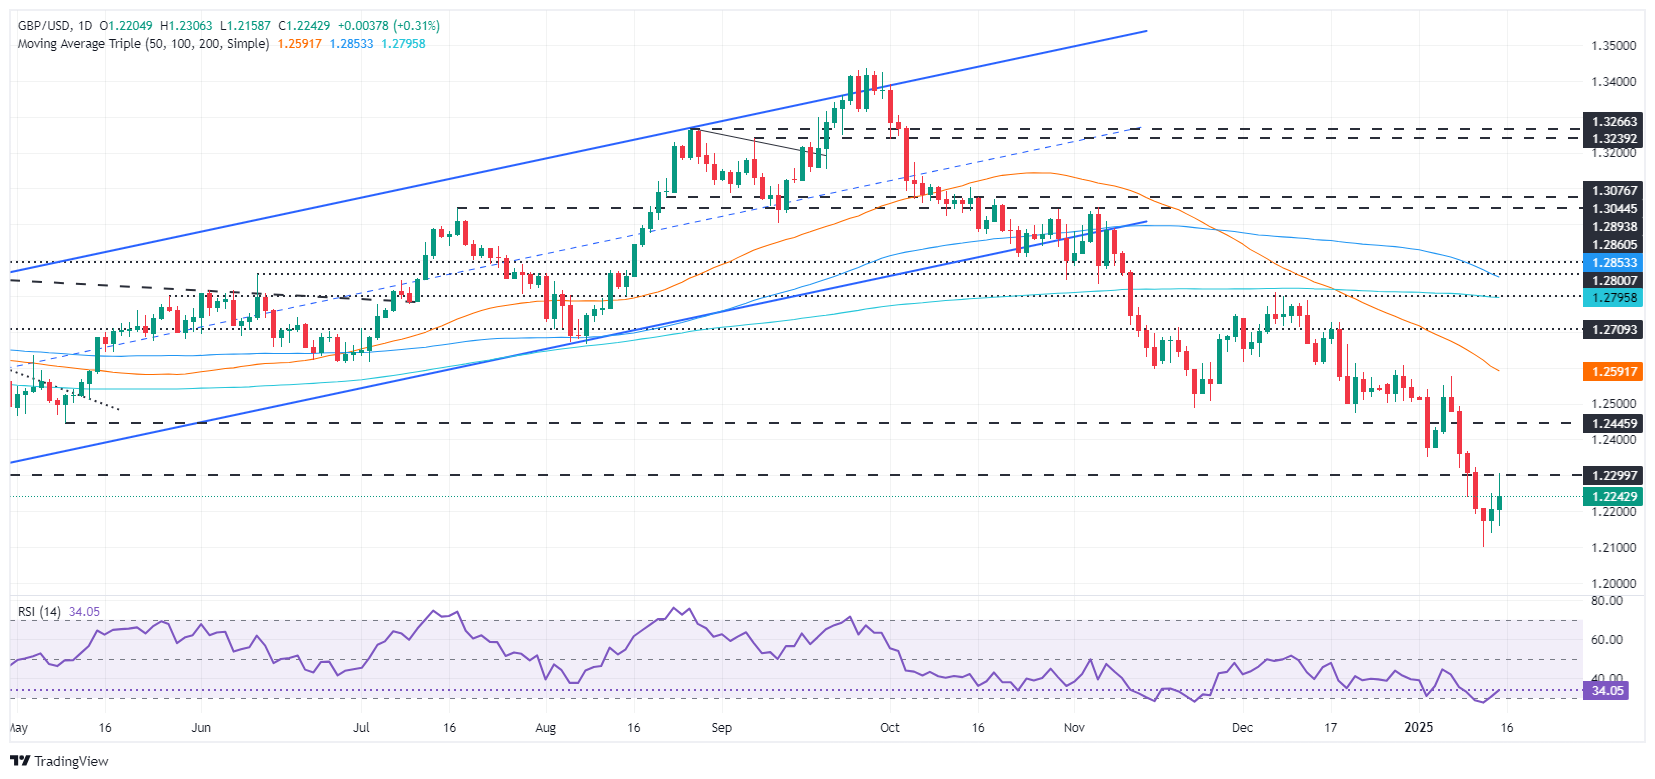
GBP/USD Price Forecast: Technical outlook

The GBP/USD downtrend remains in place, although it consolidated at around 1.2210 - 1.2240. During the session, buyers tested strong resistance at the April 22 low of 1.2299 before retreating beneath 1.2250. Should they hold to gains above the latter, they could challenge 1.2299 before targeting 1.2351, the January 2 swing low that turned resistance. Further upside is at 1.2400.

The downtrend could resume once sellers clear 1.2200. Once cleared, the next support would be the January 14 low of 1.2136, followed by the January 13 bottom of 1.2099.

GBP/USD Price Chart - Daily

British Pound PRICE Today

The table below shows the percentage change of British Pound (GBP) against listed major currencies today. British Pound was the strongest against the Japanese Yen.

  USD EUR GBP JPY CAD AUD NZD CHF
USD   -0.00% -0.00% 0.00% -0.00% -0.00% -0.01% 0.01%
EUR 0.00%   -0.01% 0.02% 0.00% -0.01% 0.00% 0.01%
GBP 0.00% 0.00%   0.04% 0.00% 0.00% -0.01% 0.00%
JPY 0.00% -0.02% -0.04%   -0.01% -0.02% -0.02% -0.02%
CAD 0.00% 0.00% -0.00% 0.00%   -0.00% -0.01% 0.00%
AUD 0.00% 0.00% -0.00% 0.02% 0.00%   0.00% 0.00%
NZD 0.00% 0.00% 0.00% 0.02% 0.00% -0.00%   0.00%
CHF -0.01% -0.01% -0.01% 0.02% -0.00% -0.00% -0.01%  

The heat map shows percentage changes of major currencies against each other. The base currency is picked from the left column, while the quote currency is picked from the top row. For example, if you pick the British Pound from the left column and move along the horizontal line to the US Dollar, the percentage change displayed in the box will represent GBP (base)/USD (quote).

Disclaimer: For information purposes only. Past performance is not indicative of future results.
placeholder
Gold price declines amid risk-on sentiment despite Fed rate cut expectationsGold price (XAU/USD) continues with its struggle to find acceptance above the $3,400 mark and attracts heavy selling during the Asian session on Monday.
Author  FXStreet
Aug 11, 2025
Gold price (XAU/USD) continues with its struggle to find acceptance above the $3,400 mark and attracts heavy selling during the Asian session on Monday.
placeholder
EUR/USD Price Forecast: Keeps bullish vibe above 1.1600 despite France’s deepening political crisisThe EUR/USD pair loses ground to near 1.1620 during the early European session on Monday.
Author  FXStreet
Oct 27, 2025
The EUR/USD pair loses ground to near 1.1620 during the early European session on Monday.
placeholder
ECB Policy Outlook for 2026: What It Could Mean for the Euro’s Next MoveWith the ECB likely holding rates steady at 2.15% and the Fed potentially extending cuts into 2026, EUR/USD may test 1.20 if Eurozone growth proves resilient, but weaker growth and an ECB pivot could pull the pair back toward 1.13 and potentially 1.10.
Author  Mitrade
Dec 26, 2025
With the ECB likely holding rates steady at 2.15% and the Fed potentially extending cuts into 2026, EUR/USD may test 1.20 if Eurozone growth proves resilient, but weaker growth and an ECB pivot could pull the pair back toward 1.13 and potentially 1.10.
placeholder
Gold plummets below $4,200 as US‑Iran tensions spur hawkish rate bets ahead of US CPIGold (XAU/USD) extends the recent breakdown momentum below a technically significant 200-day Simple Moving Average (SMA) and drops to a fresh low since March 23, further below the $4,200 mark during the Asian session on Wednesday.
Author  FXStreet
Yesterday 08: 26
Gold (XAU/USD) extends the recent breakdown momentum below a technically significant 200-day Simple Moving Average (SMA) and drops to a fresh low since March 23, further below the $4,200 mark during the Asian session on Wednesday.
placeholder
BTC Hovers Near 60,000 Mark After Plunge. US May CPI Set to Be Revealed, How Is Wall Street Betting?Bitcoin's rebound falters as the U.S.-Iran conflict and CPI data likely sustain downward pressure.On June 10, escalating U.S.-Iran tensions put the already fragile crypto market to the te
Author  TradingKey
Yesterday 09: 57
Bitcoin's rebound falters as the U.S.-Iran conflict and CPI data likely sustain downward pressure.On June 10, escalating U.S.-Iran tensions put the already fragile crypto market to the te
Related Instrument
goTop
quote