

Mexican Peso dips with the Dollar firming up ahead of US CPI data
- The US Dollar picks up supported by a sourer market sentiment ahead of the US CPI release.
- Soft Mecican CPI data has increased hopes of a 25 bps rate cut next week and is weighing on the MXN.
- Technically, USD/MXN’s double top at 20.80 suggests the possibility of a deeper correction.
The Mexican Peso (MXN) is drifting lower from the key 20.00 area weighed by a stronger US Dollar (USD). A somewhat sourer market sentiment on Tuesday is supporting the safe-haven Greenback, while the MXN is still weighed by the weak Mexican inflation data seen on Monday.
The US Dollar is picking up across the board as investors' focus shifts to the US Consumer Prices Index (CPI) release, due on Wednesday. The market consensus hints toward a sticky inflation reading, which endorses the view of a shallow Federal Reserve’s (Fed) easing cycle in 2025.
In Mexico, the soft consumer inflation data has countered the hawkish comments from Banxico Deputy Governor Espinosa, boosting hopes that the bank will cut rates by 25 basis points again next week.
Daily digest market movers: Mexican Peso rally loses momentum
- Consumer Inflation eased to 4.55% in the last twelve months in Mexico, down from 4.76% in the previous month. The market was expecting a 4.59% reading.
- Likewise, the core CPI dropped to 3.58% year-on-year from 3.8%, beyond the market consensus of a 3.6% reading.
- These figures boost hopes that the Bank of Mexico will cut rates by 25 bps for the fourth consecutive time, after their December 19 meeting.
- In the US, The main focus is Wednesday’s CPI data. Yearly inflation is expected to have ticked up to 2.7% in November, from 2.6% in October. The Core CPI, more relevant from the monetary policy perspective, is seen steady at 3.3%.
- On Friday, US Nonfarm payrolls showed a 227,000 increase in November, beating expectations of a 200,000 rise. October’s data was revised to a 36,000 increment from the previously estimated 12,000 payrolls.
- The US Unemployment Rate, however, increased to 4.2% from 4.1% in October, which cemented hopes of a Federal Reserve (Fed) cut in December, and kept the US Dollar from rallying further.
- Futures markets are now pricing an 85% chance that the Fed will cut rates by 25 basis points in December, up from below 70% last week, according to data from the CME Group’s Fed Watch tool.
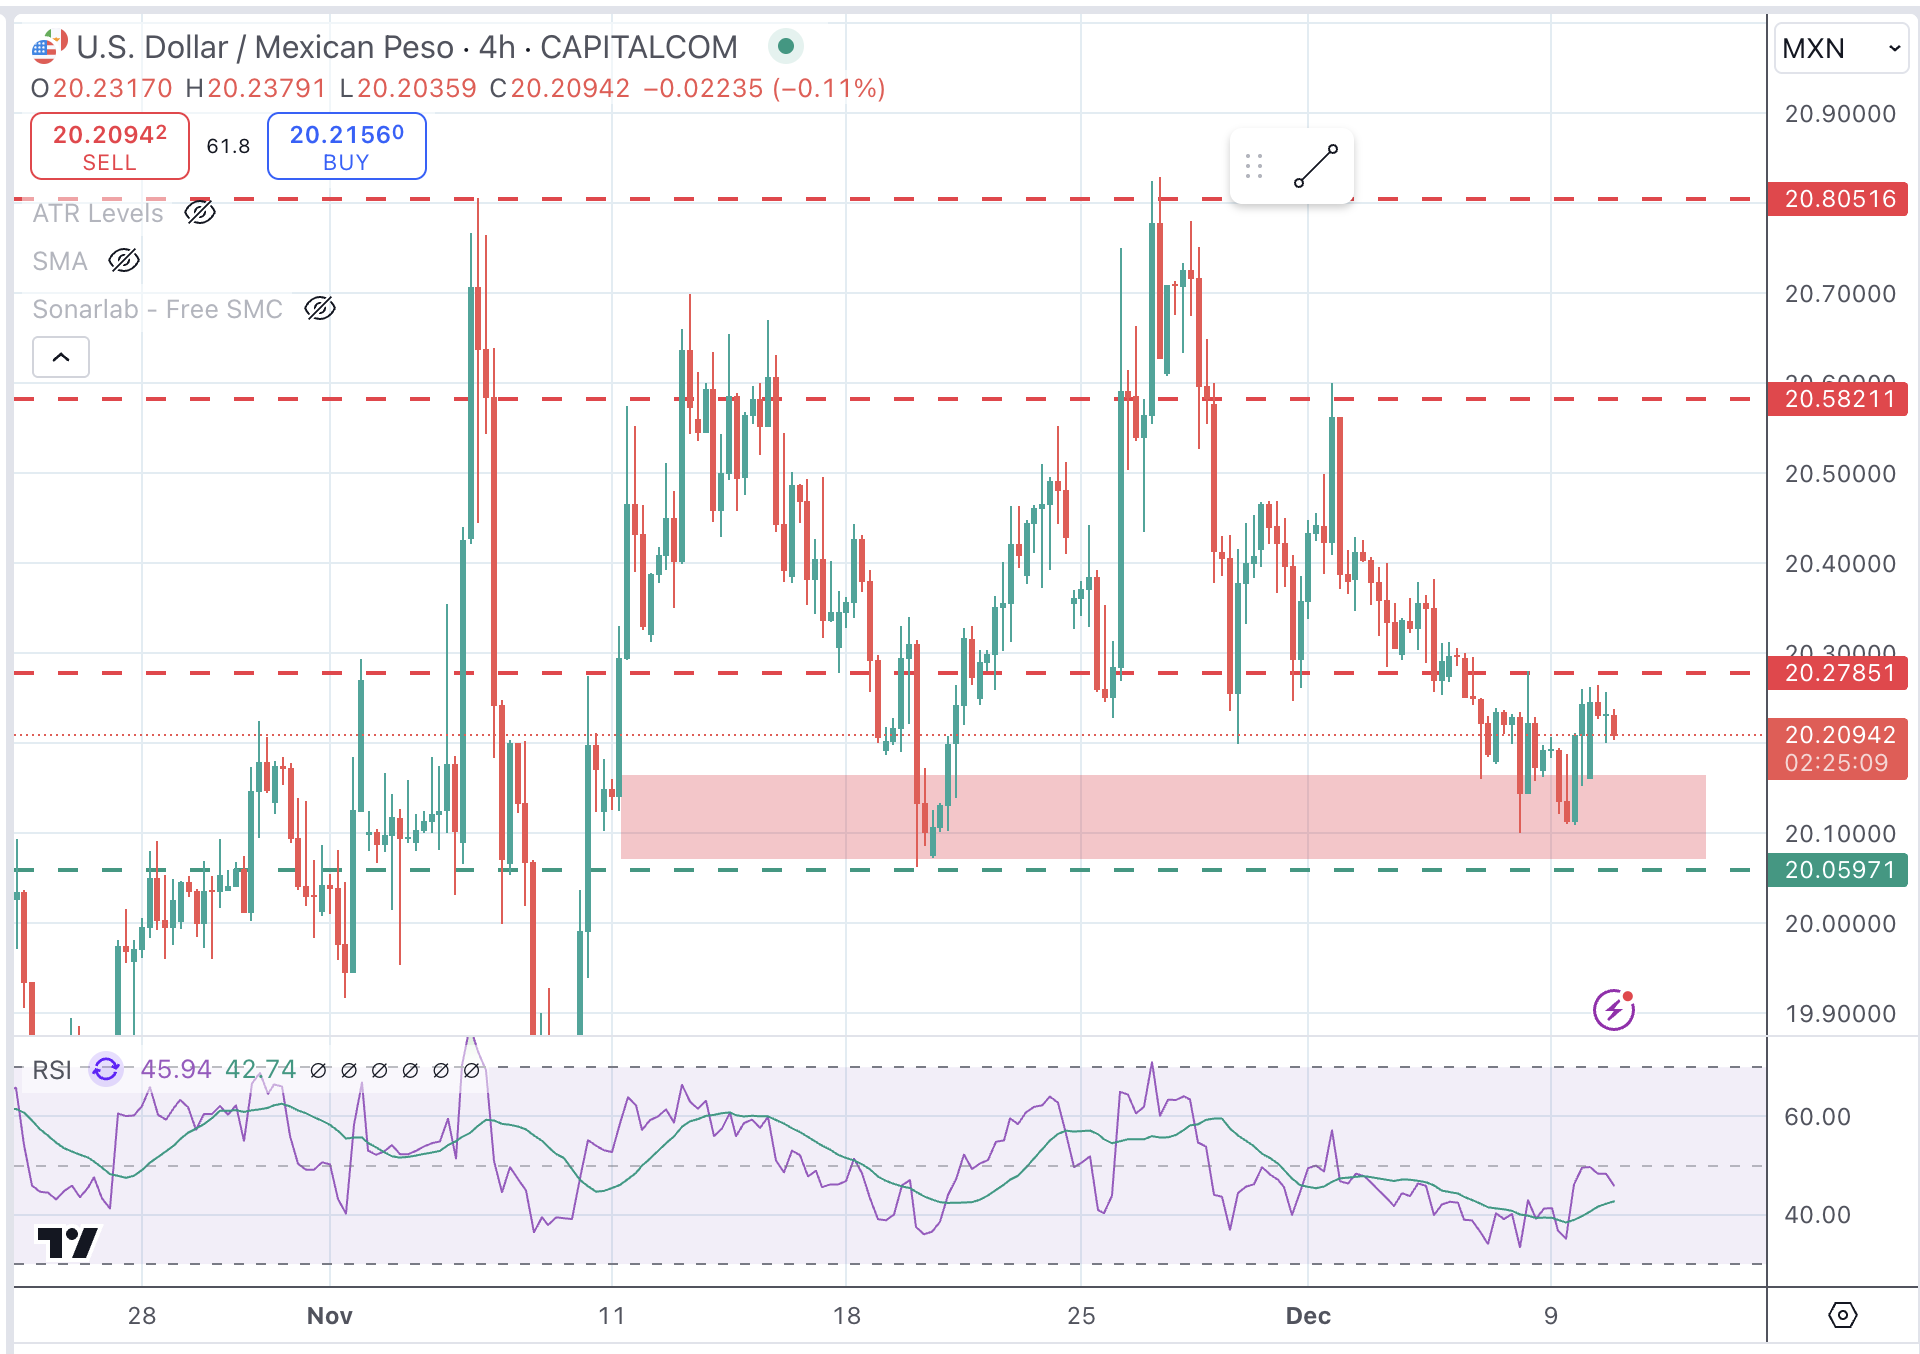
Mexican Peso technical outlook: USD/MXN recovery remains capped below 20.27
The USD/MXN has found support at the 20.00 support area to pare previous losses although it remains capped below the December high, at 2.27 so far.
Technical indicators are mixed, with the 4-hour Relative Strength Index (RSI) still in bearish territory below the 50 level. From a broader perspective, the bearish trend remains intact, with the double top at 20.80 suggesting the possibility of a deeper correction.
Immediate resistance is at the mentioned December 6 high at 20.27, ahead of the December 2 high at 20.60 and November’s peak at 20.80. On the downside, the 20.00 psychological level is the neckline of the mentioned double top ahead of November’s low, at 19.75.
USD/MXN 4-Hour Chart
US Dollar PRICE Today
The table below shows the percentage change of US Dollar (USD) against listed major currencies today. US Dollar was the strongest against the New Zealand Dollar.
| USD | EUR | GBP | JPY | CAD | AUD | NZD | CHF | |
|---|---|---|---|---|---|---|---|---|
| USD | 0.20% | -0.08% | 0.33% | -0.04% | 0.64% | 0.72% | 0.12% | |
| EUR | -0.20% | -0.27% | 0.10% | -0.24% | 0.44% | 0.52% | -0.07% | |
| GBP | 0.08% | 0.27% | 0.37% | 0.04% | 0.72% | 0.79% | 0.20% | |
| JPY | -0.33% | -0.10% | -0.37% | -0.34% | 0.33% | 0.40% | -0.18% | |
| CAD | 0.04% | 0.24% | -0.04% | 0.34% | 0.67% | 0.76% | 0.16% | |
| AUD | -0.64% | -0.44% | -0.72% | -0.33% | -0.67% | 0.08% | -0.51% | |
| NZD | -0.72% | -0.52% | -0.79% | -0.40% | -0.76% | -0.08% | -0.59% | |
| CHF | -0.12% | 0.07% | -0.20% | 0.18% | -0.16% | 0.51% | 0.59% |
The heat map shows percentage changes of major currencies against each other. The base currency is picked from the left column, while the quote currency is picked from the top row. For example, if you pick the US Dollar from the left column and move along the horizontal line to the Japanese Yen, the percentage change displayed in the box will represent USD (base)/JPY (quote).
Recommended Articles


