NZD/JPY Price Analysis: Pair fell towards 88.00 as bears secure control

Source Fxstreet
  • NZD/JPY fell 0.79% on Monday, trading near 88.05.
  • After breaking out of a range last week, bears pushed NZD/JPY lower, towards 88.00.
  • Indicators continue losing ground but approach oversold conditions which might trigger a period of consolidation.

The NZD/JPY declined by 0.79% to 88.05 on Monday, after breaking out of a clear side-ways range last week. The Relative Strength Index (RSI) and the Moving Average Convergence Divergence (MACD) indicators are losing ground and confirm the selling pressure, and the outlook is now bearish, at least for the short-term.

In that sense, the RSI is in the oversold area, signaling rising selling pressure, while the MACD is also indicating that bearish momentum is increasing. The RSI suggests oversold conditions, may trigger consolidation, but the indicators' continued decline indicates that the downtrend is likely to persist. In case the cross corrects upwards, the bulls might attempt to recover the 89.00 area, and if lucky, they might extend a recovery to 90.00. On the downside, the selling traction is strong enough to continue pushing the pair towards the 85.00-86.00 range if the buyers don’t step in.
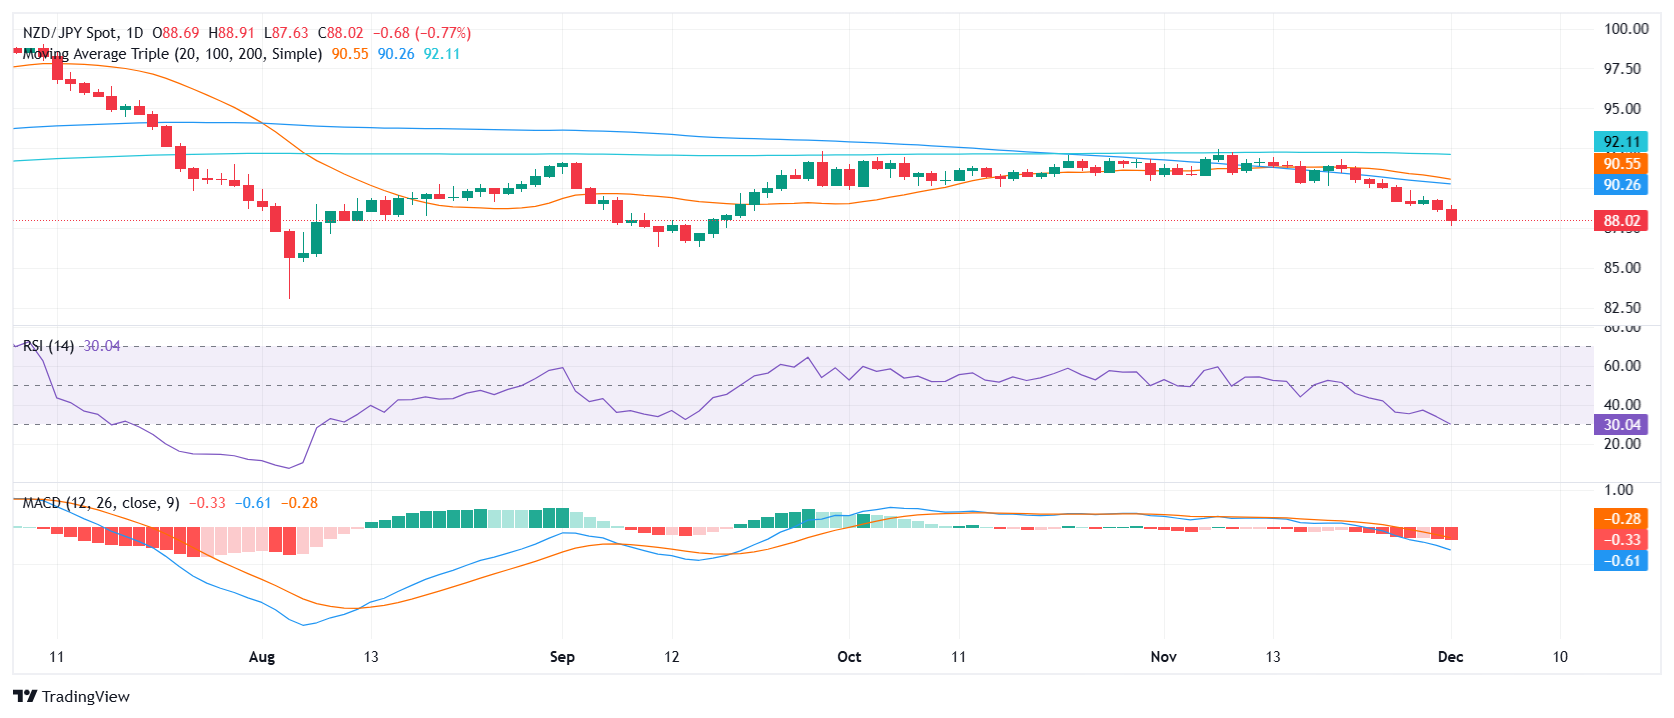
NZD/JPY daily chart

Disclaimer: For information purposes only. Past performance is not indicative of future results.
placeholder
Solana Price Eyes $70 as Founder Anatoly Yakovenko Bins Narrative That SOL Is an Ethereum KillerSolana founder Anatoly Yakovenko has binned the narrative that SOL is an Ethereum killer. It is okay for the two technologies to have overlapping features and compete.
Author  FXStreet
Dec 04, 2023
Solana founder Anatoly Yakovenko has binned the narrative that SOL is an Ethereum killer. It is okay for the two technologies to have overlapping features and compete.
placeholder
Hidden Bullish Divergence Appears On Dogecoin Price Chart, Here’s What To Expect NextA hidden Bullish Divergence pattern has just been identified on the Dogecoin price chart, signaling possibilities of a significant uptrend. With this new technical pattern, a crypto analyst has projected a target of $0.7 for the Dogecoin price.
Author  Bitcoinist
Nov 22, 2024
A hidden Bullish Divergence pattern has just been identified on the Dogecoin price chart, signaling possibilities of a significant uptrend. With this new technical pattern, a crypto analyst has projected a target of $0.7 for the Dogecoin price.
placeholder
OKX is preparing to go public in the United StatesOKX, one of the largest cryptocurrency exchanges by trading volume, is preparing to go public in the United States.
Author  Cryptopolitan
Jun 23, 2025
OKX, one of the largest cryptocurrency exchanges by trading volume, is preparing to go public in the United States.
placeholder
ECB Policy Outlook for 2026: What It Could Mean for the Euro’s Next MoveWith the ECB likely holding rates steady at 2.15% and the Fed potentially extending cuts into 2026, EUR/USD may test 1.20 if Eurozone growth proves resilient, but weaker growth and an ECB pivot could pull the pair back toward 1.13 and potentially 1.10.
Author  Mitrade
Dec 26, 2025
With the ECB likely holding rates steady at 2.15% and the Fed potentially extending cuts into 2026, EUR/USD may test 1.20 if Eurozone growth proves resilient, but weaker growth and an ECB pivot could pull the pair back toward 1.13 and potentially 1.10.
placeholder
Gold gains momentum above $4,100 after weak US NFP data Gold price (XAU/USD) gains traction to around $4,125 during the early Asian session on Friday. The precious metal extends the rally after weaker-than-expected US Nonfarm Payrolls ‌(NFP) data reduced expectations of Federal Reserve (Fed) interest rate hikes this year.
Author  FXStreet
Yesterday 01: 43
Gold price (XAU/USD) gains traction to around $4,125 during the early Asian session on Friday. The precious metal extends the rally after weaker-than-expected US Nonfarm Payrolls ‌(NFP) data reduced expectations of Federal Reserve (Fed) interest rate hikes this year.
Related Instrument
goTop
quote