EUR/AUD Price Forecast: Drops and hovers around 1.6200

Source Fxstreet
  • EUR/AUD remains pressured below 50, 100, and 200-day SMAs, holding above 1.6200 for four consecutive days.
  • Break above 1.6252 could target 1.6300, with 1.6372 (SMA confluence) as the next resistance zone.
  • Downside risk remains intact, with support seen at 1.6159 and major support at 1.5966 if the pair dips below 1.6200.

The EUR/AUD pair remains pressured, yet buyers trimmed some of its earlier losses with the pair hitting a daily low of 1.6159. At the time of writing, the cross-pair trades at 1.6216, down by just 0.12%.

EUR/AUD Price Forecast: Technical outlook

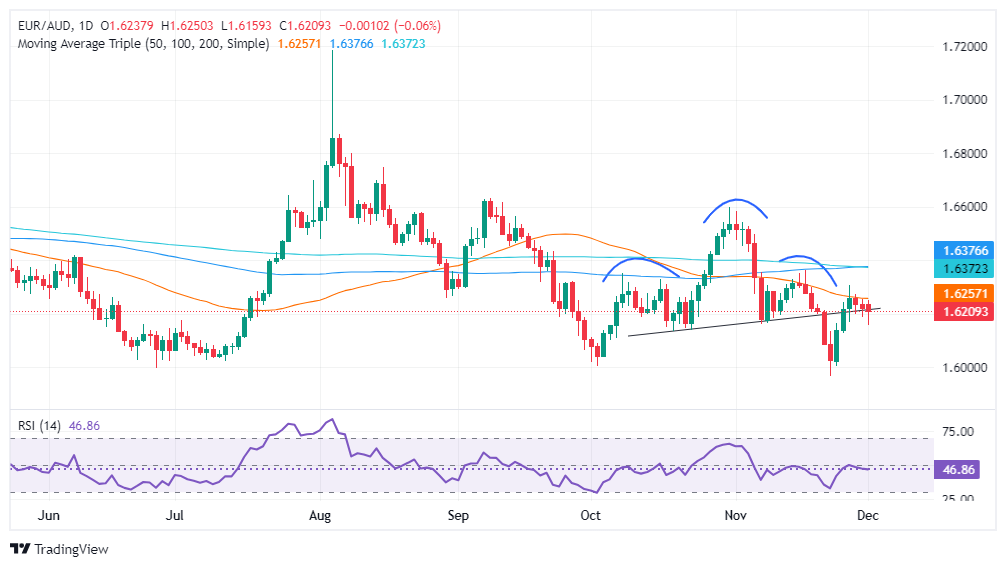
The EUR/AUD consolidates above 1.6200 for the fourth straight day, and despite trading below the 50, 100, and 200-day Simple Moving Averages (SMAs), the pair is neutrally biased.

If EUR/AUD climbs past the 50-day SMA of 1.6252, buyers could challenge the 1.6300 figure. A breach of the latter will expose the confluence of the 100 and 200-day SMAs at 1.6372 before aiming toward 1.6400.

On the other hand, the RBA’s restrictive monetary policy stance favors the downside of EUR/AUD. Therefore, if EUR/AUD drops below 1.6200, the first support would be a December 2 low of 1.6159. On further weakness, the next stop would be major support at the November 22 swing low of 1.5966

EUR/AUD Price Chart – Daily

Euro PRICE Today

The table below shows the percentage change of Euro (EUR) against listed major currencies today. Euro was the strongest against the Swiss Franc.

  USD EUR GBP JPY CAD AUD NZD CHF
USD   0.00% -0.00% 0.00% -0.01% -0.03% -0.05% 0.00%
EUR -0.00%   -0.01% -0.02% -0.01% -0.03% -0.05% 0.00%
GBP 0.00% 0.00%   0.02% -0.01% -0.03% -0.04% 0.02%
JPY 0.00% 0.02% -0.02%   -0.02% -0.05% -0.07% -0.00%
CAD 0.01% 0.00% 0.01% 0.02%   -0.02% -0.03% 0.03%
AUD 0.03% 0.03% 0.03% 0.05% 0.02%   -0.02% 0.05%
NZD 0.05% 0.05% 0.04% 0.07% 0.03% 0.02%   0.06%
CHF -0.00% 0.00% -0.02% 0.00% -0.03% -0.05% -0.06%  

The heat map shows percentage changes of major currencies against each other. The base currency is picked from the left column, while the quote currency is picked from the top row. For example, if you pick the Euro from the left column and move along the horizontal line to the US Dollar, the percentage change displayed in the box will represent EUR (base)/USD (quote).


Disclaimer: For information purposes only. Past performance is not indicative of future results.
placeholder
Today’s Market Recap: AI Panic Intensifies, Global Assets Fall BroadlyTracking Market TrendsTradingKey - On the eve of the U.S. CPI data release, AI panic escalated. Amid deep-seated concerns that artificial intelligence will disrupt business models across many industri
Author  TradingKey
8 hours ago
Tracking Market TrendsTradingKey - On the eve of the U.S. CPI data release, AI panic escalated. Amid deep-seated concerns that artificial intelligence will disrupt business models across many industri
placeholder
Silver Price Forecast: XAG/USD rebounds above $76.50 after sharp drop, eyes on US CPI dataSilver price (XAG/USD) recovers some lost ground to near $76.60 during the Asian trading hours on Friday. The white metal suddenly fell late Thursday, pushing silver down more than 11%.
Author  FXStreet
16 hours ago
Silver price (XAG/USD) recovers some lost ground to near $76.60 during the Asian trading hours on Friday. The white metal suddenly fell late Thursday, pushing silver down more than 11%.
placeholder
Is SaaS Dead? The Truth Behind the Software Meltdown, the Missing Floor, and the Peak That’s Not Coming BackOver the past few weeks, you’ve probably seen the same refrain everywhere: “SaaS has crashed this much, valuations must have bottomed, time to buy the dip.”On the surface, that sounds tempting. A lot
Author  TradingKey
Yesterday 10: 22
Over the past few weeks, you’ve probably seen the same refrain everywhere: “SaaS has crashed this much, valuations must have bottomed, time to buy the dip.”On the surface, that sounds tempting. A lot
placeholder
Bitcoin Realized Losses Rival Luna Crash Levels as Market Absorbs $2 Billion HitBitcoin network realizes $1.99 billion in losses, rivaling the 2022 Luna crash, though analysts view the $67,000 flush as a cyclical cleanse rather than a structural breakdown.
Author  Mitrade
Yesterday 07: 38
Bitcoin network realizes $1.99 billion in losses, rivaling the 2022 Luna crash, though analysts view the $67,000 flush as a cyclical cleanse rather than a structural breakdown.
placeholder
Financial Markets 2026: Volatility Catalysts in Gold, Silver, Oil, and Blue-Chip Stocks—A CFD Trader's OutlookThe financial world is perpetually in motion, but the landscape for 2026 seems to be shaping up to be particularly dynamic. For CFD traders navigating global markets, this heightened volatility could present a distinctive set of challenges and opportunities.
Author  Rachel Weiss
Yesterday 05: 31
The financial world is perpetually in motion, but the landscape for 2026 seems to be shaping up to be particularly dynamic. For CFD traders navigating global markets, this heightened volatility could present a distinctive set of challenges and opportunities.
Related Instrument
goTop
quote