

GBP/USD Price Forecast: Dives below 200-day SMA and 1.2800
- GBP/USD breaches 200-day SMA, turning bearish with potential to test support at 1.2700.
- Mixed labor data and technical indicators suggest further downside risk for the Pound.
- Recovery above 1.2800 needed for bullish resumption, with 1.2900 and 1.2993 as key targets.
The Pound Sterling plummets more than 0.60% on Tuesday, after labor market data was mixed, with the Unemployment Rate rising sharply, as the economy added over 220K jobs to the economy, 150K less than in the previous reading. At the time of writing, the GBP/USD trades at 1.2792, below the 1.2800 handle for the first time since mid-August 2024.
GBP/USD Price Forecast: Technical outlook
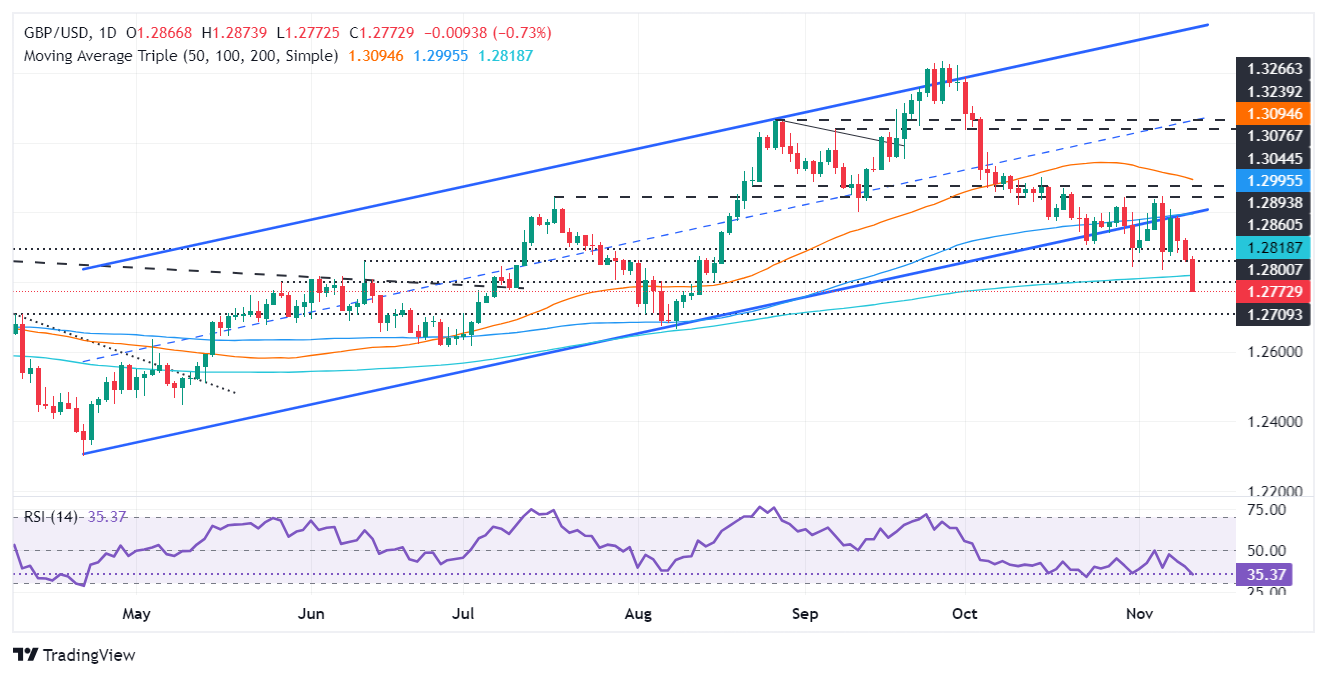
The GBP/USD plunged below the 200-day Simple Moving Average (SMA) of 1.2817. A daily close confirmation would turn the pair bearish, and it might open the door to test the next intermediate support at the 1.2700 figure, followed by major support at August 8 swing low of 1.2664.
For a bullish continuation, buyers must regain 1.2800 and lift the spot prices above the 1.2833/43 are, support levels hit on November 6 and October 31, respectively, before testing 1.2900. Up next would be the 100-day SMA at 1.2993.
Indicators such as the Relative Strength Index (RSI) remains deeply bearish, though not yet turned oversold. Therefore, further GBP/USD downside is seen.
GBP/USD Price Chart – Daily
British Pound PRICE Today
The table below shows the percentage change of British Pound (GBP) against listed major currencies today. British Pound was the strongest against the Australian Dollar.
| USD | EUR | GBP | JPY | CAD | AUD | NZD | CHF | |
|---|---|---|---|---|---|---|---|---|
| USD | 0.43% | 0.73% | 0.54% | 0.10% | 0.54% | 0.42% | 0.13% | |
| EUR | -0.43% | 0.31% | 0.13% | -0.32% | 0.11% | -0.00% | -0.29% | |
| GBP | -0.73% | -0.31% | -0.20% | -0.63% | -0.18% | -0.32% | -0.60% | |
| JPY | -0.54% | -0.13% | 0.20% | -0.44% | 0.00% | -0.12% | -0.41% | |
| CAD | -0.10% | 0.32% | 0.63% | 0.44% | 0.44% | 0.32% | 0.03% | |
| AUD | -0.54% | -0.11% | 0.18% | 0.00% | -0.44% | -0.12% | -0.41% | |
| NZD | -0.42% | 0.00% | 0.32% | 0.12% | -0.32% | 0.12% | -0.29% | |
| CHF | -0.13% | 0.29% | 0.60% | 0.41% | -0.03% | 0.41% | 0.29% |
The heat map shows percentage changes of major currencies against each other. The base currency is picked from the left column, while the quote currency is picked from the top row. For example, if you pick the British Pound from the left column and move along the horizontal line to the US Dollar, the percentage change displayed in the box will represent GBP (base)/USD (quote).
Recommended Articles


