EUR/GBP Price Analysis: Negative trend continues, downside risks prevail

Source Fxstreet
  • EUR/GBP pair is on a four-day losing streak, reaching lows not seen in over a week
  • The MACD's rising red bars and declining RSI indicate increasing bearish momentum, suggesting further weakness for the pair.
  • Pair has broken deep below its 20-day SMA, reaching multi-week lows.

The EUR/GBP fell towards 0.8310 as sellers continue pushing downwards but will face strong support at the psychological 0.8300 area.
The cross has been on a downward trajectory, breaking below its 20-day SMA and reaching multi-week lows. Technical indicators such as the Relative Strength Index (RSI) and the Moving Average Convergence Divergence (MACD) confirm this bearish trend, signaling increasing selling momentum. The pair has recorded four consecutive days of losses, indicating that the selling pressure is intensifying, and further declines are possible.

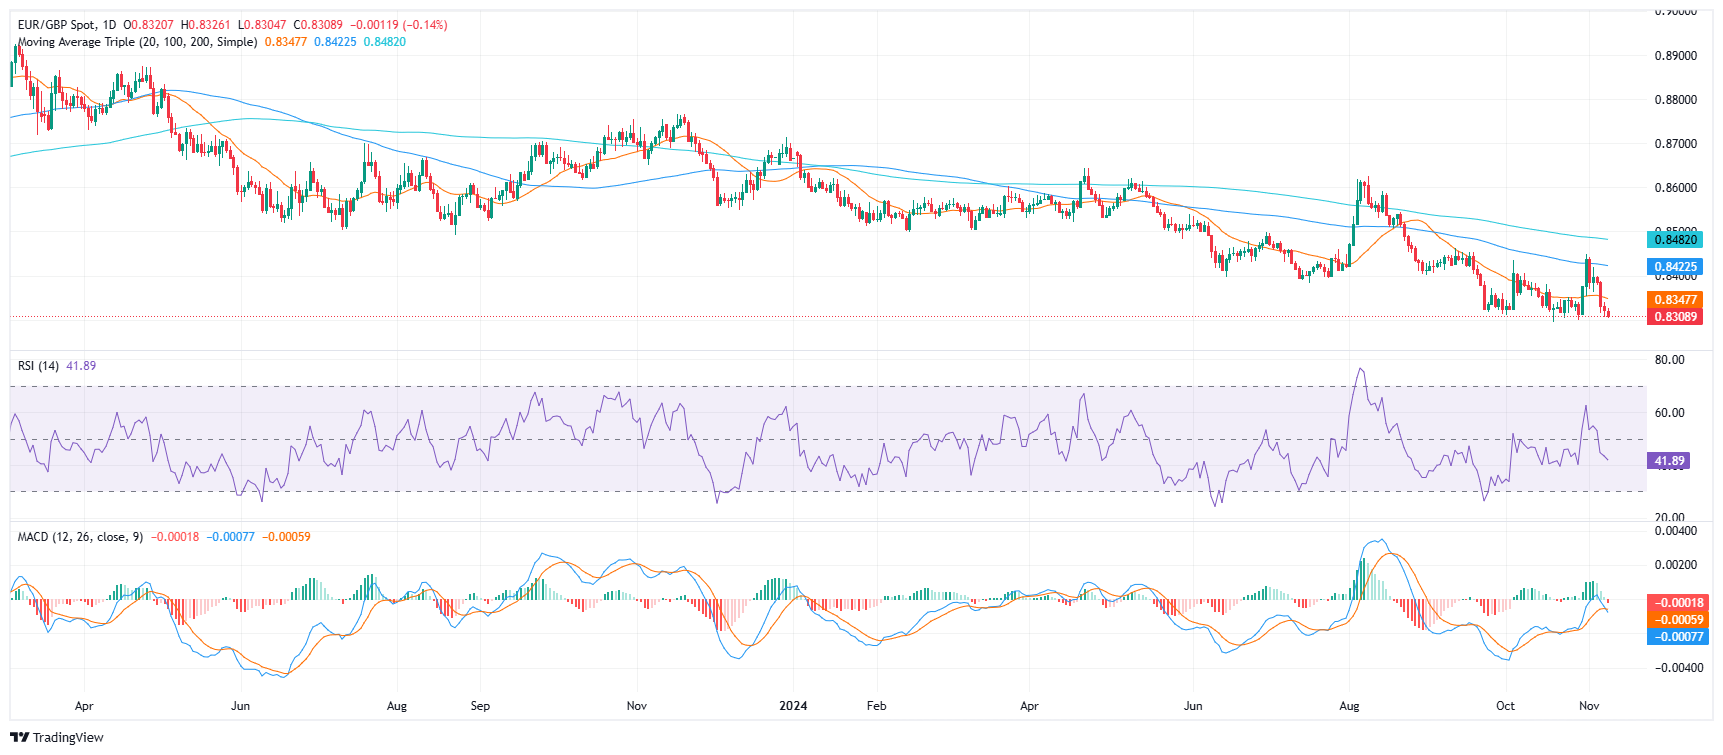
The RSI is currently in negative territory at 42, with a mildly declining slope, implying that sellers are gaining momentum. The MACD's rising red histogram and elevated volume further support the bearish sentiment, indicating that bearish forces are dominating the market.

Support levels: 0.8300, 0.8275, 0.8250.
Resistance levels:0.8330, 0.8350, 0.8375. 

EUR/GBP daily chart

Disclaimer: For information purposes only. Past performance is not indicative of future results.
placeholder
Bitcoin Drops Below $70,000 as Crypto Rally Fails to MaterializeThe crypto market experienced a significant pullback, Bitcoin (BTCUSD) fell below the key $70,000 mark during intraday trading, triggering short-term stop-loss orders and causing market s
Author  TradingKey
9 hours ago
The crypto market experienced a significant pullback, Bitcoin (BTCUSD) fell below the key $70,000 mark during intraday trading, triggering short-term stop-loss orders and causing market s
placeholder
Gold falls below $4,850 as Fed holds rates steadyGold price (XAU/USD) faces some selling pressure near $4,830 during the early Asian session on Thursday.
Author  FXStreet
17 hours ago
Gold price (XAU/USD) faces some selling pressure near $4,830 during the early Asian session on Thursday.
placeholder
WTI Crude Prices Capped at $100, Has the Rally Ended? How to Trade the Short Term? Today (March 18), WTI crude oil continued to exhibit significant short-term volatility, driven by a tug-of-war between headlines and data. Intraday, prices retreated from Tuesday's high o
Author  TradingKey
Yesterday 10: 33
Today (March 18), WTI crude oil continued to exhibit significant short-term volatility, driven by a tug-of-war between headlines and data. Intraday, prices retreated from Tuesday's high o
placeholder
Silver Price Forecast: XAG/USD consolidates above $79.00; bearish bias intact ahead of FedSilver (XAG/USD) lacks a firm intraday direction and oscillates in a narrow range during the Asian session on Wednesday as traders opt to wait on the sidelines ahead of the crucial FOMC rate decision.
Author  FXStreet
Yesterday 02: 16
Silver (XAG/USD) lacks a firm intraday direction and oscillates in a narrow range during the Asian session on Wednesday as traders opt to wait on the sidelines ahead of the crucial FOMC rate decision.
placeholder
WTI rises above $95.00 as Iran's attacks on facilities fuel supply fearsWest Texas Intermediate (WTI), the US crude oil benchmark, is trading around $95.00 during the early Asian trading hours on Wednesday. The WTI price climbs amid intensifying Middle East conflict and severe supply disruptions.
Author  FXStreet
Yesterday 01: 29
West Texas Intermediate (WTI), the US crude oil benchmark, is trading around $95.00 during the early Asian trading hours on Wednesday. The WTI price climbs amid intensifying Middle East conflict and severe supply disruptions.
Related Instrument
goTop
quote