

GBP/CAD Price Prediction: Rising Wedge pattern could be vulnerable to break down
Source Fxstreet
- GBP/CAD might be completing a bearish Rising Wedge price pattern.
- If so, there is an increased risk of a downside break.
GBP/CAD recovers to trade back inside its Rising Wedge pattern after temporarily falling below the lower boundary line. It remains vulnerable to a downside break.
Rising Wedges are bearish patterns. Although there is no way of confirming GBP/CAD has formed one for sure it looks likely that it has.
GBP/CAD 4-hour Chart
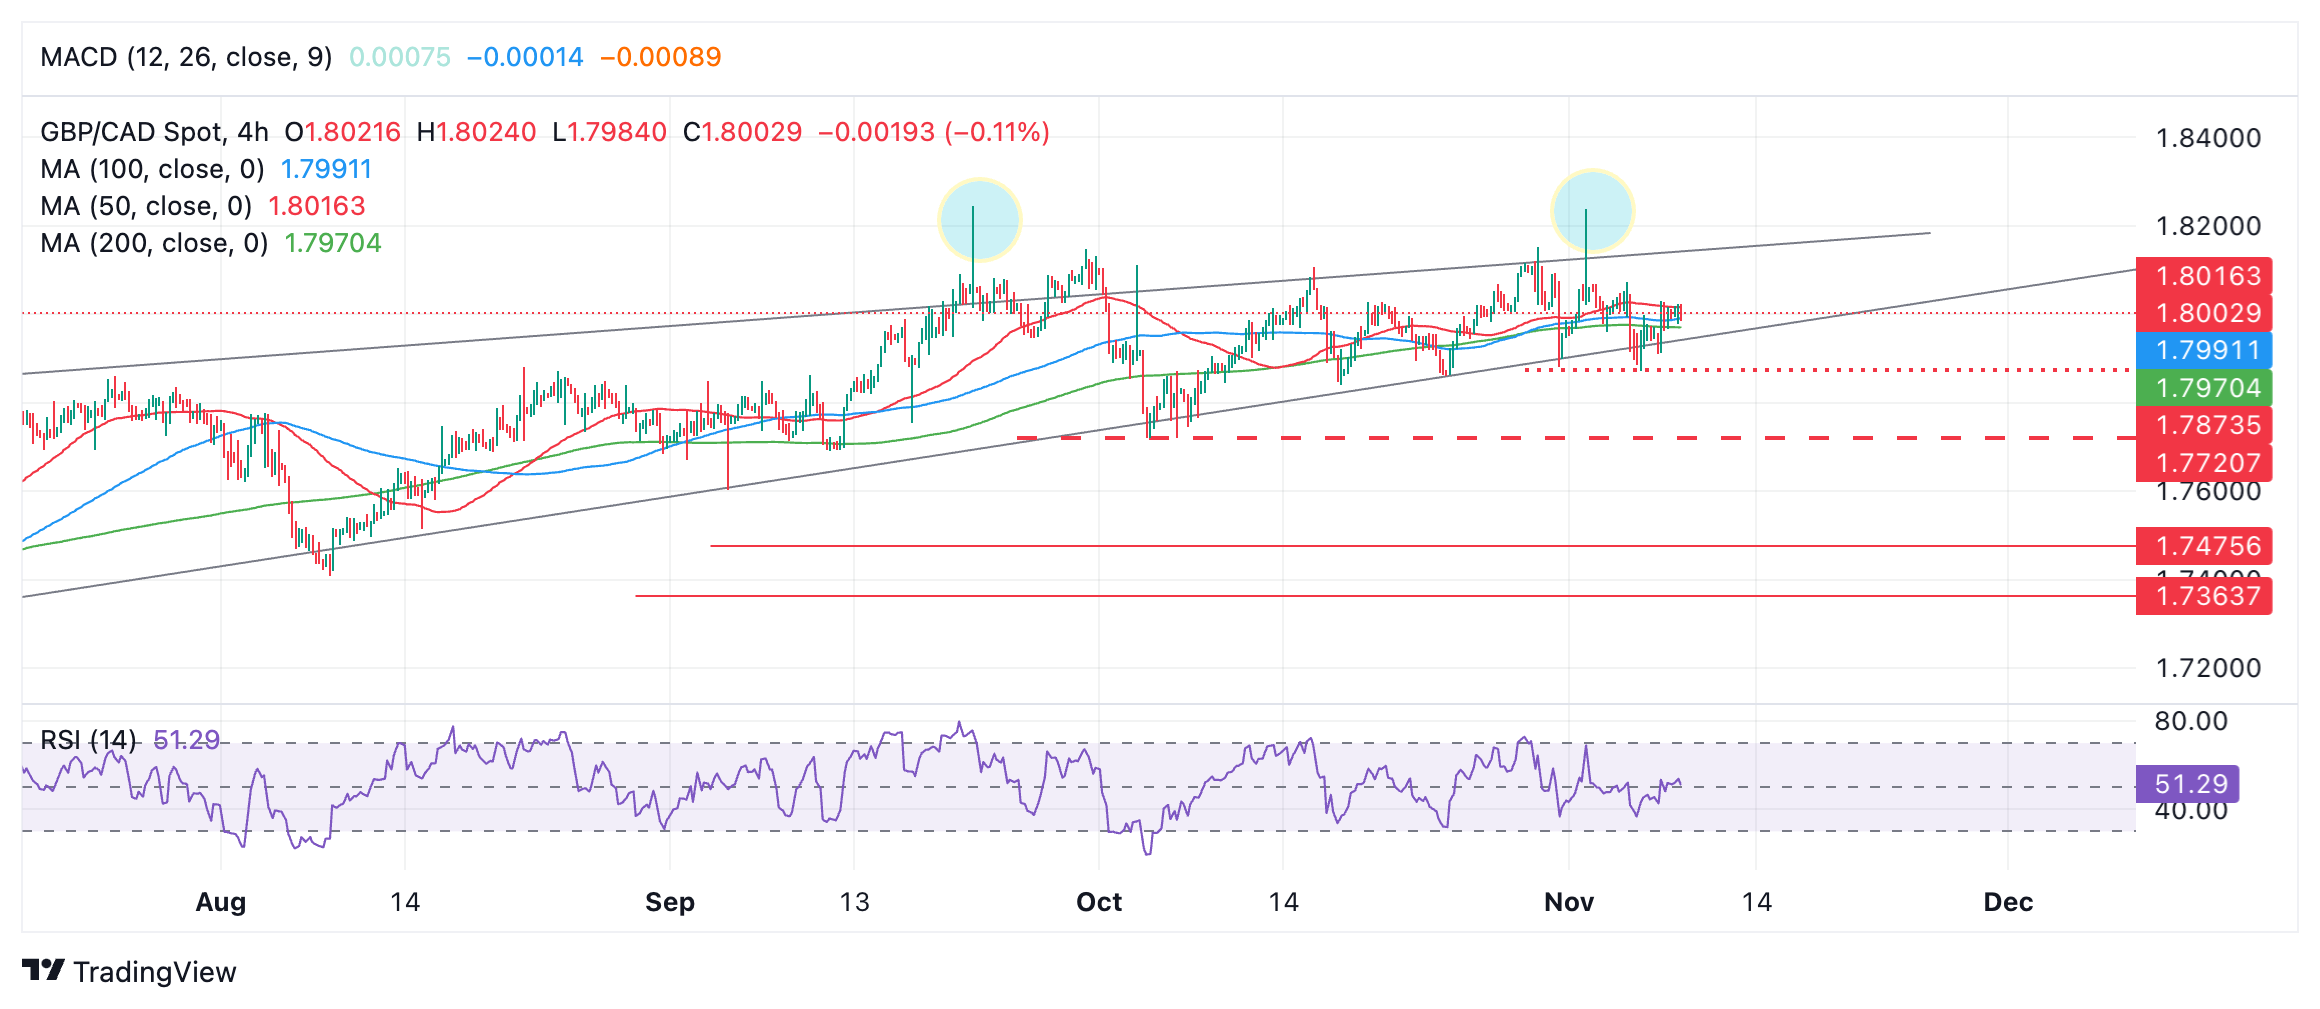
A break below the lower boundary line and then below 1.7871 (November 6 low) would probably confirm a decisive breakdown and lead to a decline to 1.7719, the October 3 swing low.
GBP/CAD broke temporarily above the upper guardrail of the Rising Wedge pattern on several occasions (blue circles on chart) on September 20 and November 1. This could be a sign of bullish exhaustion and an early warning of impending reversal.
Disclaimer: For information purposes only. Past performance is not indicative of future results.
Recommended Articles

Prioritize filling the $27,000 gap and even try higher.
Billionaire Elon Musk recently raised funds for his two high-profile tech companies, xAI and Neuralink.
After a turbulent 2025, what lies ahead for commodities, forex, and cryptocurrency markets in 2026?
Silver (XAG/USD) is trading lower in an otherwise calm market session on Thursday.
US President Donald Trump says Iran talks to begin Monday after canceling attackUS President Donald Trump said that fresh round of Iran talks would begin Monday after he cancelled a planned attack on Iran partially in response to pleas from US allies in the Middle East, including Saudi Arabia, Bloomberg reported on Monday.
US President Donald Trump said that fresh round of Iran talks would begin Monday after he cancelled a planned attack on Iran partially in response to pleas from US allies in the Middle East, including Saudi Arabia, Bloomberg reported on Monday.
Related Instrument


