EUR/GBP Price Analysis: Consolidation on as the pair awaits directional cues

Source Fxstreet
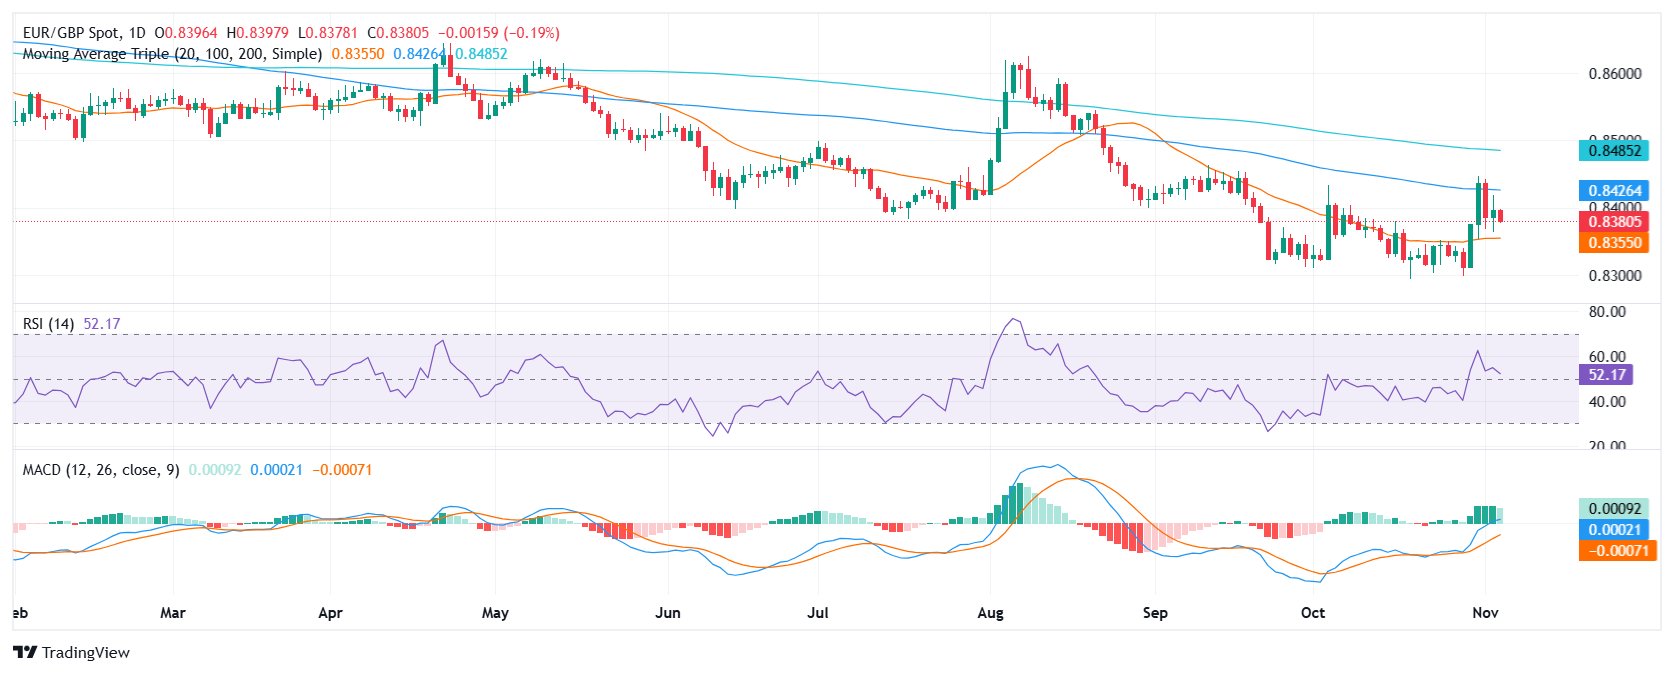
  • The EUR/GBP cross faced rejection at the crucial 100-day SMA last week, signaling a potential shift in trend.
  • The cross might sideways within a range defined by the 100-day SMA and the 20-day SMA providing support.

The EUR/GBP cross has been exhibiting a sideways trend in recent trading sessions, consolidating within a narrow range. This consolidation phase is likely to continue until a decisive breakout occurs in either direction, providing further guidance on the cross's future trajectory. On Tuesday de cross mildly declined towards the 0.8380 area.

The Relative Strength Index (RSI) is at 55 indicating that buying pressure is declining as is in the positive area and has a mildly declining slope. The Moving Average Convergence Divergence (MACD) is green and decreasing, also suggesting that bullish momentum is waning. 

Overall, the technical indicators suggest that the EUR/GBP cross is in a neutral phase, with both bullish and bearish forces vying for control. A breakout from the current range between the 20 and 100-day Simple Moving Average (SMA) will provide further clarity on the cross's future direction. With some signs of bearish forces emerging, the 20-day SMA at 0.8350 might be set to recieve a visit in the near term.

EUR/GBP daily chart
 

Disclaimer: For information purposes only. Past performance is not indicative of future results.
placeholder
U.S. September Nonfarm Payrolls: Two-Scenario Analysis, Will U.S. Stocks Diverge in Short-Term and Medium-to-Long-Term Trends?1. IntroductionAffected by the U.S. government shutdown, the September nonfarm payrolls report—originally scheduled for release in early October—will be officially published on 20 November. As a key "
Author  TradingKey
8 hours ago
1. IntroductionAffected by the U.S. government shutdown, the September nonfarm payrolls report—originally scheduled for release in early October—will be officially published on 20 November. As a key "
placeholder
Ethereum Dips Below $3,000: Is the Bull Market at an End?Ethereum's price plunged below $3,000 for the first time in four months, marking growing concerns of a potential end to the bull market.
Author  Mitrade
15 hours ago
Ethereum's price plunged below $3,000 for the first time in four months, marking growing concerns of a potential end to the bull market.
placeholder
Ethereum Edges Toward Long-Term Holders’ Cost Basis, Now Only 8% Above Key Accumulation LevelEthereum is trading near $3,150 and just 8% above a key $2,895 long-term holders’ cost basis, with on-chain flows, macro uncertainty and support around $3,000–$2,800 all shaping what comes next for ETH.
Author  Mitrade
16 hours ago
Ethereum is trading near $3,150 and just 8% above a key $2,895 long-term holders’ cost basis, with on-chain flows, macro uncertainty and support around $3,000–$2,800 all shaping what comes next for ETH.
placeholder
Gold Price Forecast: XAU/USD declines below $4,050 on USD strength and hawkish Fed comments Gold price (XAU/USD) extends the decline to around $4,030 during the early Asian session on Tuesday. The precious metal edges lower as traders dialed back expectations of a US interest rate cut next month.
Author  FXStreet
17 hours ago
Gold price (XAU/USD) extends the decline to around $4,030 during the early Asian session on Tuesday. The precious metal edges lower as traders dialed back expectations of a US interest rate cut next month.
placeholder
Bitcoin's 2025 Gains Erased: Who Ended the BTC Bull Market?After slumping below $93,500, 2025 Bitcoin price gains have been completely wiped out. Investors are puzzled as to why its bull market, underpinned by political tailwinds, institutionaliz
Author  TradingKey
Yesterday 10: 36
After slumping below $93,500, 2025 Bitcoin price gains have been completely wiped out. Investors are puzzled as to why its bull market, underpinned by political tailwinds, institutionaliz
goTop
quote