USD/CAD declines for second day after Kamala comeback

Source Fxstreet
  • USD/CAD falls as the US Dollar weakens following a late-stage comeback by Kamala Harris in Republican safe-State Iowa.  
  • A Harris win would be negative for USD whilst a Trump victory would strengthen the Dollar, say analysts. 
  • The Canadian Dollar labors under a black cloud of fundamentals including a weak economy and falling Oil prices. 

USD/CAD trades down by about three-tenths of a percent in the 1.3860s on the day of the US presidential election. This comes as the US Dollar (USD) weakens after a late surge in the polls for Democrat nominee Kamala Harris puts the election on a knife edge. Last week former President Donald Trump was ahead, albeit by a small margin. 

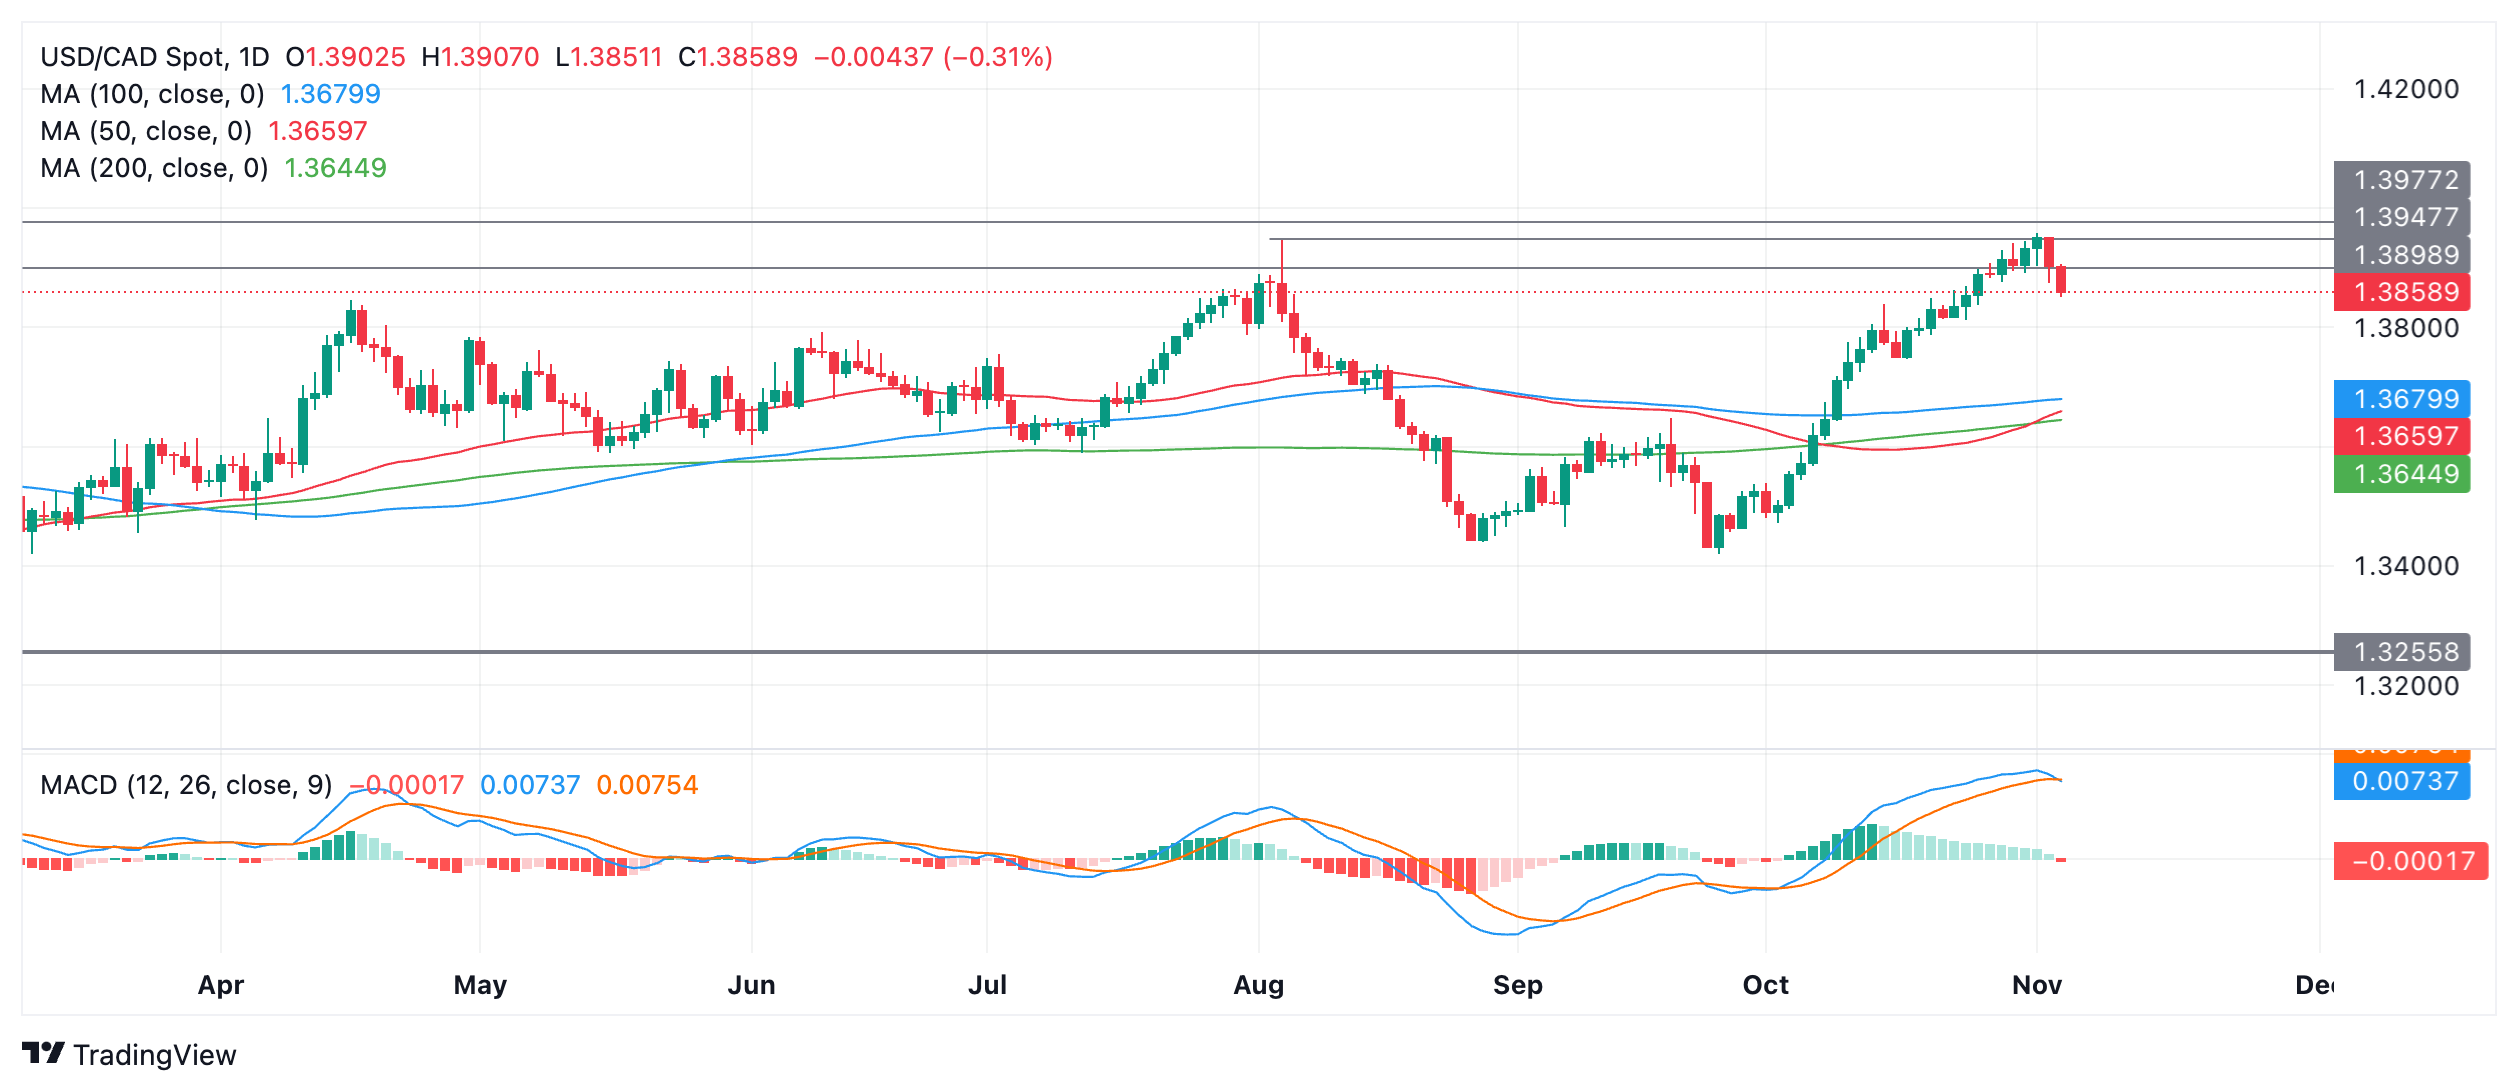
The prior expectation that Trump will win contributed to pushing the USD/CAD to a new high for the year of 1.3959 on November 1, however, Harris’ late showing in the usually safe Republican State of Iowa – according the reputedly accurate Ann Selzer poll – has led to a sell-off in the USD and the Loonie pair on Monday and Tuesday. 

USD/CAD Daily Chart

Markets are forecasting that a Harris win will be negative for the US Dollar whilst a victory for Donald Trump will have the oposite impact. Trump’s threats of putting tariffs on foreign imports and his inflationary tax cuts are the two main reasons – under Harris there would be no risk of tariffs.

The prediction model of the highly-rated election website 538.com is showing a 50% probability of Vice President Harris winning whilst former President Donald Trump has a 49% chance of victory. The model gives a 1% chance of there being no overall winner. 

The election uncertainty combined with the proximity of the Federal Reserve (Fed) November 6-7 meeting is putting further pressure on USD/CAD. Some analysts are speculating that the Fed may opt to make a double-dose 50 basis points (bps) (0.50%) interest rate cut simply in order to calm markets, if it is unclear who has won the election. 

“If markets spin out of control, the FOMC may opt for a 50 bps cut as a circuit breaker,” says Philip Marey, Senior US Strategist, at Rabobank.  

His views are not backed by market-based gauges of Fed policy, however, with swap rates showing zero chance of a 50 bps cut but a roughly 95% chance of a 25 bps cut instead  – and 5% probability of no cut – according to the CME FedWatch tool. 

Nor does the huge miss suffered in the October US Nonfarm Payrolls (NFP) report, which showed only 12,000 new employees in the US in the month, compared to 223,000 in September and well below expectations of 113,000, increase the odds of a 50 bps cut, according to some analysts. The weak employment gains were put down to the temporary effect of Hurricane’s Helene and Milton. 

“October’s distorted payrolls print probably won’t change the outlook for the Fed, which we expect to cut by 25 bps next week,” said Joe Maher, Assistant Economist, Capital Economics in a note on Friday. 

Trading under a cloud

The Canadian Dollar, meanwhile, continues to operate under a cloud of negative fundamentals which may limit downside for USD/CAD. 

The Bank of Canada (BoC) has been one of the most aggressive major central banks when it comes to cutting interest rates this year, having cut the bank’s cash rate from 5.00% in May 2024 to 3.75% currently. This includes a double-dose 50 bps (0.50%) cut in October. Lower interest rates are usually negative for a currency as they reduce foreign capital inflows. 

Markets are further betting the BoC might cut by another 50 bps at its meeting in December due to overall weak fundamentals, particularly if employment data continues to show a decline. 

“We think Friday’s Canadian employment report should tell a familiar story – that the labor market has continued to weaken in October amid slowing hiring demand,” says Nathan Janzen, Assistant Chief Economist at RBC in a recent note. 

A further source of weakness for CAD is the steep sell-off in Crude Oil, which is only just rebounding from the mid-$60s per barrel (WTI Crude) and entering the $70 region. Oil is Canada’s largest export so Oil prices can impact gross demand for its currency. 

Green shoots through the ice

Not all is doom and gloom, however, and there are signs of green shoots in the Canadian economy which the more optimistic argue might lead the BoC to relax its stance to future easing. 

Most recently, the S&P Global Canada Manufacturing PMI rose to 51.1 in October from 50.4 in the previous month, “the second consecutive expansion in Canadian factory activity after 17 consecutive monthly contractions,” according to Trading Economics. 

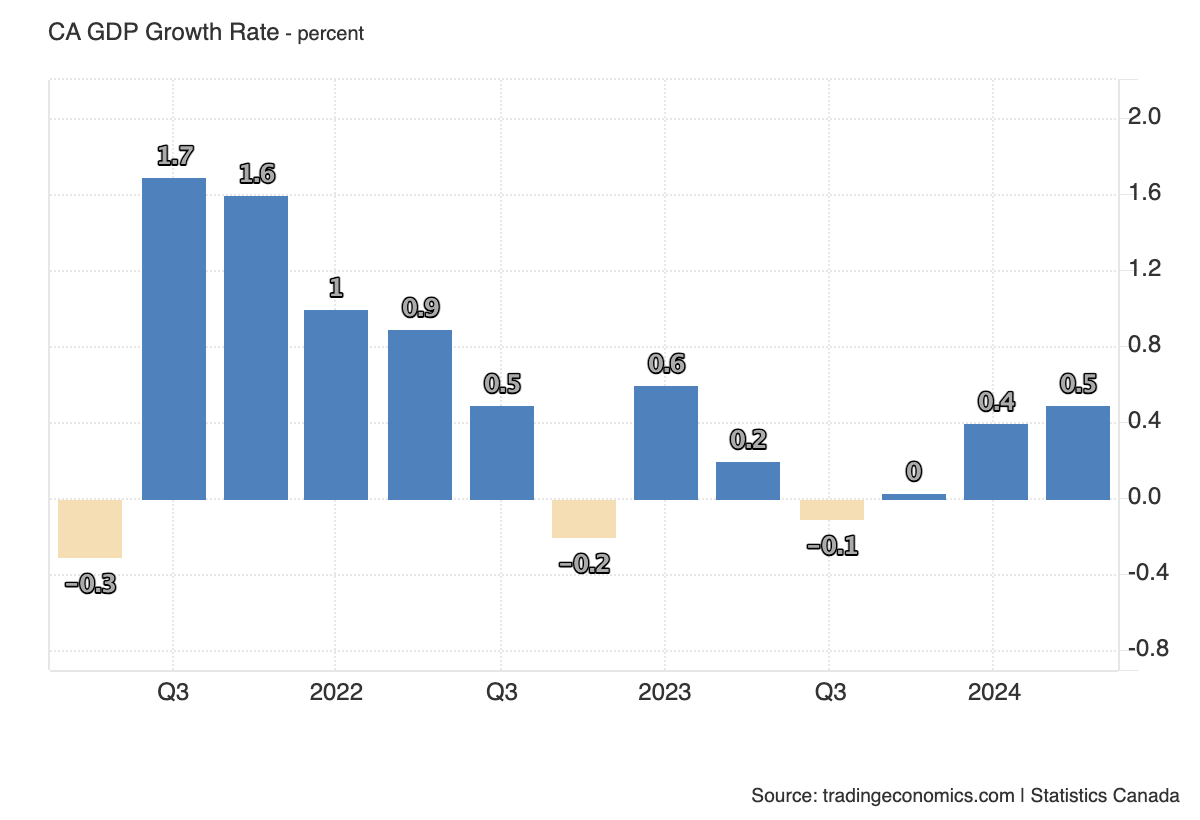
In addition, Canadian GDP looks to have lifted from its nadir at the end of 2023 when Canada almost fell into a recession. In the second quarter of 2024 the Canadian economy grew by 0.5% compared to the previous quarter, up from 0.4% in Q1. 

That said, not all analysts are optimistic about the outlook for the economy. National Bank of Canada foresees even more weakness for the Canadian Dollar as GDP slows due to a marked decline in Canadian population growth. 

“According to the latest targets, population growth is now projected to decline for two consecutive years – a first in modern history. If this unprecedented shift is implemented swiftly, it will likely dampen GDP growth in the coming quarters,” says National Bank’s Strategist Stéfane Marion. 

The reduced GDP growth compared to the US moreover is likely to lead to a divergence in central bank policy between the two nations. Whereas the Fed might take a more cautious approach to cutting interest rates, the BoC could be forced to continue slashing them. Such a scenario would drive USD/CAD higher, with Marion revising up her target for pair from 1.41 in November 2024 to 1.45. 

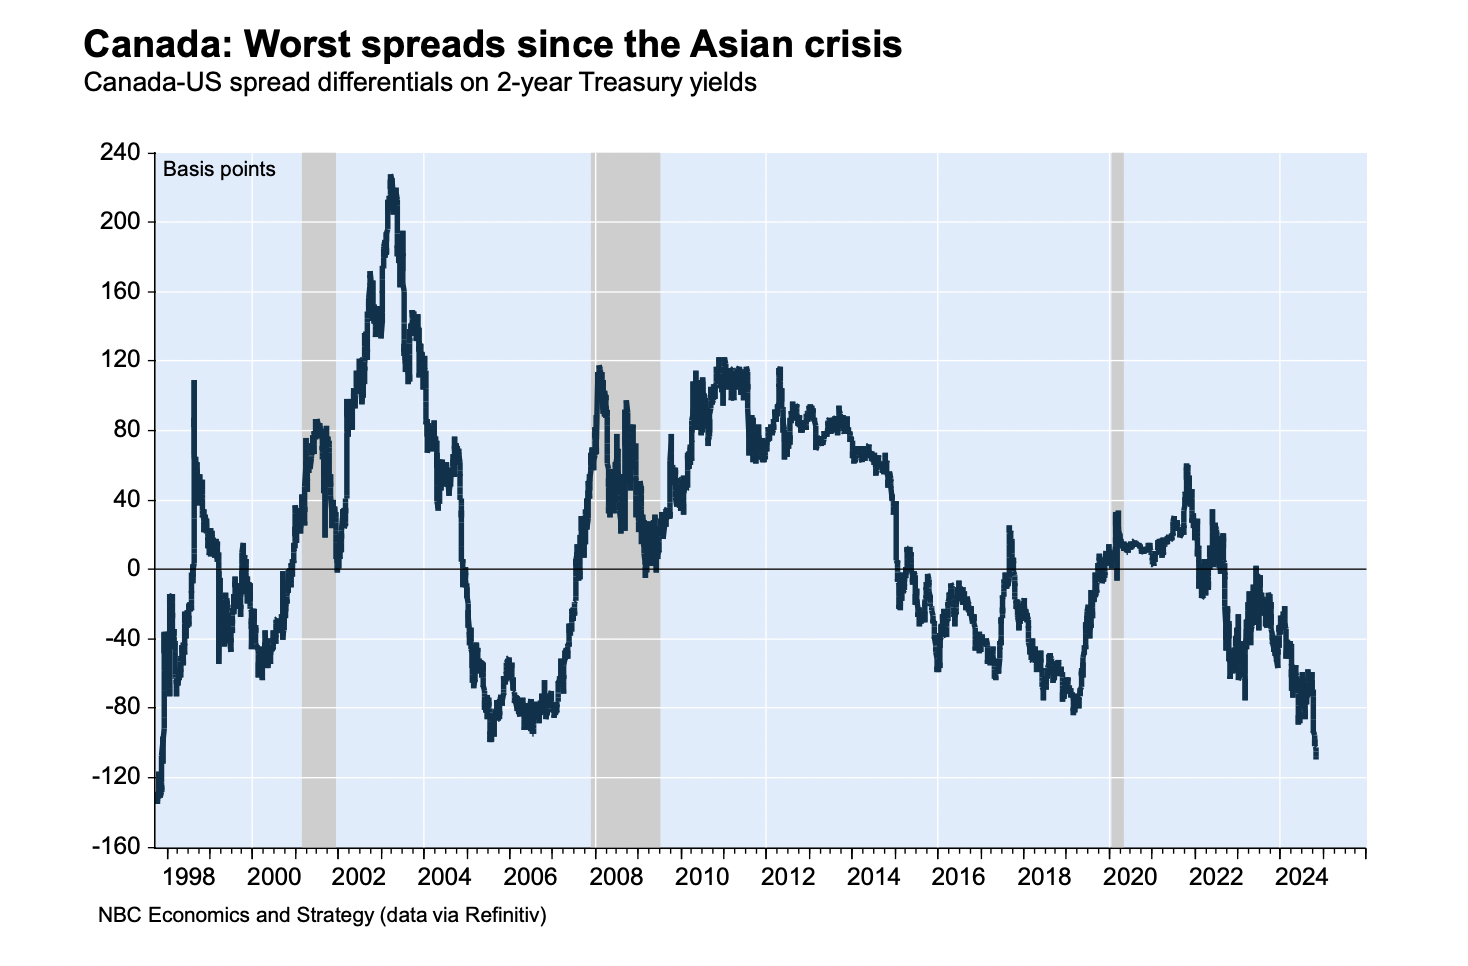
Swap spreads between US and Canadian government bonds – often seen as a proxy for the exchange rate – are already at a low not seen since the Asian financial crisis in the 1990s, says the strategist. 

“While the U.S. economy is operating in a state of excess demand, Canada is grappling with excess capacity,” Marion notes. “As today’s Hot Chart shows, this unusual development supports a significant divergence in monetary policy, now reflected in the widest spreads on 2-year Treasury yields between Canada and the U.S. since the 1997-98 Asian crisis—a key driver of the exchange rate.” 


Disclaimer: For information purposes only. Past performance is not indicative of future results.
placeholder
Gold Price Forecast: XAU/USD drifts higher above $4,200 as Fed delivers expected cutGold price (XAU/USD) gains momentum to around $4,235 during the early Asian session on Thursday. The precious metal extends its upside after the US Federal Reserve (Fed) delivered an expected third consecutive interest rate cut and maintained its outlook for just one cut in 2026.
Author  FXStreet
Dec 11, Thu
Gold price (XAU/USD) gains momentum to around $4,235 during the early Asian session on Thursday. The precious metal extends its upside after the US Federal Reserve (Fed) delivered an expected third consecutive interest rate cut and maintained its outlook for just one cut in 2026.
placeholder
Ethereum Price Slips Lower — $3,000 Looms as the Key BattlegroundEthereum is attempting to recover from a $3,026 low but remains below $3,200 and the 100-hour SMA, with a bearish trend line near $3,175 capping rebounds as bulls need a clean break above $3,200 to target $3,250–$3,400, while a drop below $3,050 risks a retest of $3,000 and $2,940.
Author  Mitrade
Dec 15, Mon
Ethereum is attempting to recover from a $3,026 low but remains below $3,200 and the 100-hour SMA, with a bearish trend line near $3,175 capping rebounds as bulls need a clean break above $3,200 to target $3,250–$3,400, while a drop below $3,050 risks a retest of $3,000 and $2,940.
placeholder
Bitcoin Slides 5% as Sellers Lean In — Can BTC Reclaim $88,000?Bitcoin has dropped back below $88,000 after rolling over from $90,500, with price still trading under the 100-hour Simple Moving Average. The sell-off found a floor at $85,151, and BTC is now consolidating near that base, but rebounds are facing pressure from a bearish trend line around $89,000. Bulls need to retake $88,000–$89,000 to ease downside risk; failure to do so keeps $85,500–$85,000 and then $83,500 in play, with $80,000 as the deeper “line in the sand.” Bitcoin (BTC) is back in damage-control mode after a sharp pullback wiped out recent gains. The price failed to reclaim the $90,000–$90,500 band, rolled over, and slid through $88,500 before briefly dipping under $87,000. Buyers did show up around $85,000, but the rebound so far looks more like stabilization than a clear trend reversal. Bitcoin dips hard, finds a bid near $85,000(h3) BTC’s latest move lower began when it couldn’t build follow-through above $90,000 and $90,500. Once that upside stalled, sellers took control and pushed price down through $88,500. The slide accelerated enough to spike below $87,000, but the market didn’t free-fall. Bulls defended the $85,000 zone, printing a low at $85,151. Since then, Bitcoin has been consolidating below the 23.6% Fibonacci retracement of the drop from the $93,560 swing high to the $85,151 low — a clue that the bounce is still shallow and that sellers haven’t fully backed off yet. Structurally, BTC is still on the back foot: It’s trading below $88,000, and It remains below the 100-hour Simple Moving Average, keeping short-term trend pressure pointed downward. Resistance is layered, and $89,000 is the problem area(h3) If bulls try to turn this into a recovery, they’ll have to climb through multiple ceilings in quick succession. First, BTC faces resistance around $87,150, followed by a more meaningful barrier near $87,500. From there, the market’s attention snaps back to $88,000 — the level BTC just lost and now needs to reclaim. A close back above $88,000 would improve the tone, but it doesn’t solve the bigger issue: there’s a bearish trend line on the hourly BTC/USD chart (Kraken feed) with resistance near $89,000, which also lines up with the next technical hurdle. If BTC can push through $89,000 and hold, the rebound could extend toward $90,000, with follow-through targets at $91,000 and $91,500. But until price clears that $88,000–$89,000 zone, rallies are at risk of being sold rather than chased. If BTC fails to reclaim resistance, the downside path is clear(h3) The near-term bear case is simple: if Bitcoin can’t climb back above the $87,000 area and keep traction, sellers may attempt another leg lower. Support levels line up like this: Immediate support: $85,500 First major support: $85,000 Next support: $83,500 Then $82,500 in the near term Below that, the major “don’t break this” level is still $80,000. If BTC slips under $80,000, the risk of acceleration to the downside increases significantly — not because it’s magic, but because it’s the kind of psychological and structural level that tends to trigger forced de-risking. Indicators: momentum still leans bearish(h3) The intraday indicators aren’t offering much comfort yet: Hourly MACD is losing pace in the bearish zone. Hourly RSI remains below 50, suggesting sellers still have the upper hand on short timeframes. So while the $85,000 defense held for now, the market hasn’t flipped bullish — it’s just stopped bleeding.
Author  Mitrade
Dec 16, Tue
Bitcoin has dropped back below $88,000 after rolling over from $90,500, with price still trading under the 100-hour Simple Moving Average. The sell-off found a floor at $85,151, and BTC is now consolidating near that base, but rebounds are facing pressure from a bearish trend line around $89,000. Bulls need to retake $88,000–$89,000 to ease downside risk; failure to do so keeps $85,500–$85,000 and then $83,500 in play, with $80,000 as the deeper “line in the sand.” Bitcoin (BTC) is back in damage-control mode after a sharp pullback wiped out recent gains. The price failed to reclaim the $90,000–$90,500 band, rolled over, and slid through $88,500 before briefly dipping under $87,000. Buyers did show up around $85,000, but the rebound so far looks more like stabilization than a clear trend reversal. Bitcoin dips hard, finds a bid near $85,000(h3) BTC’s latest move lower began when it couldn’t build follow-through above $90,000 and $90,500. Once that upside stalled, sellers took control and pushed price down through $88,500. The slide accelerated enough to spike below $87,000, but the market didn’t free-fall. Bulls defended the $85,000 zone, printing a low at $85,151. Since then, Bitcoin has been consolidating below the 23.6% Fibonacci retracement of the drop from the $93,560 swing high to the $85,151 low — a clue that the bounce is still shallow and that sellers haven’t fully backed off yet. Structurally, BTC is still on the back foot: It’s trading below $88,000, and It remains below the 100-hour Simple Moving Average, keeping short-term trend pressure pointed downward. Resistance is layered, and $89,000 is the problem area(h3) If bulls try to turn this into a recovery, they’ll have to climb through multiple ceilings in quick succession. First, BTC faces resistance around $87,150, followed by a more meaningful barrier near $87,500. From there, the market’s attention snaps back to $88,000 — the level BTC just lost and now needs to reclaim. A close back above $88,000 would improve the tone, but it doesn’t solve the bigger issue: there’s a bearish trend line on the hourly BTC/USD chart (Kraken feed) with resistance near $89,000, which also lines up with the next technical hurdle. If BTC can push through $89,000 and hold, the rebound could extend toward $90,000, with follow-through targets at $91,000 and $91,500. But until price clears that $88,000–$89,000 zone, rallies are at risk of being sold rather than chased. If BTC fails to reclaim resistance, the downside path is clear(h3) The near-term bear case is simple: if Bitcoin can’t climb back above the $87,000 area and keep traction, sellers may attempt another leg lower. Support levels line up like this: Immediate support: $85,500 First major support: $85,000 Next support: $83,500 Then $82,500 in the near term Below that, the major “don’t break this” level is still $80,000. If BTC slips under $80,000, the risk of acceleration to the downside increases significantly — not because it’s magic, but because it’s the kind of psychological and structural level that tends to trigger forced de-risking. Indicators: momentum still leans bearish(h3) The intraday indicators aren’t offering much comfort yet: Hourly MACD is losing pace in the bearish zone. Hourly RSI remains below 50, suggesting sellers still have the upper hand on short timeframes. So while the $85,000 defense held for now, the market hasn’t flipped bullish — it’s just stopped bleeding.
placeholder
December Santa Claus Rally: New highs in sight for US and European stocks?Historical data show a rising trend of US and European stocks in December. If the momentum is strong, fund managers may rush in with a buying frenzy.
Author  Mitrade
Yesterday 02: 50
Historical data show a rising trend of US and European stocks in December. If the momentum is strong, fund managers may rush in with a buying frenzy.
placeholder
XRP’s Price Action Flashes a Warning Even as ETF Flows Stay PositiveXRP’s structure remains weak despite 18 straight positive closes in spot XRP ETFs, with analysts warning that $1.98 and other nearby resistance zones could cap rebounds unless the YO region is reclaimed, while deeper downside scenarios keep $1.53 on watch as a potential (not guaranteed) accumulation area.
Author  Mitrade
Yesterday 06: 37
XRP’s structure remains weak despite 18 straight positive closes in spot XRP ETFs, with analysts warning that $1.98 and other nearby resistance zones could cap rebounds unless the YO region is reclaimed, while deeper downside scenarios keep $1.53 on watch as a potential (not guaranteed) accumulation area.
goTop
quote