EUR/JPY Price Prediction: Testing top of the range – next move could be down

Source Fxstreet
  • EUR/JPY is testing the top of a multi-week range and could be about to reverse and fall. 
  • Although price action has not yet reversed, the MACD is diverging bearishly with price.  

EUR/JPY tests the top of a nine-and-a-half-week range at around 163.50 as it continues unfolding its short-term sideways trend. 

EUR/JPY 4-hour Chart 

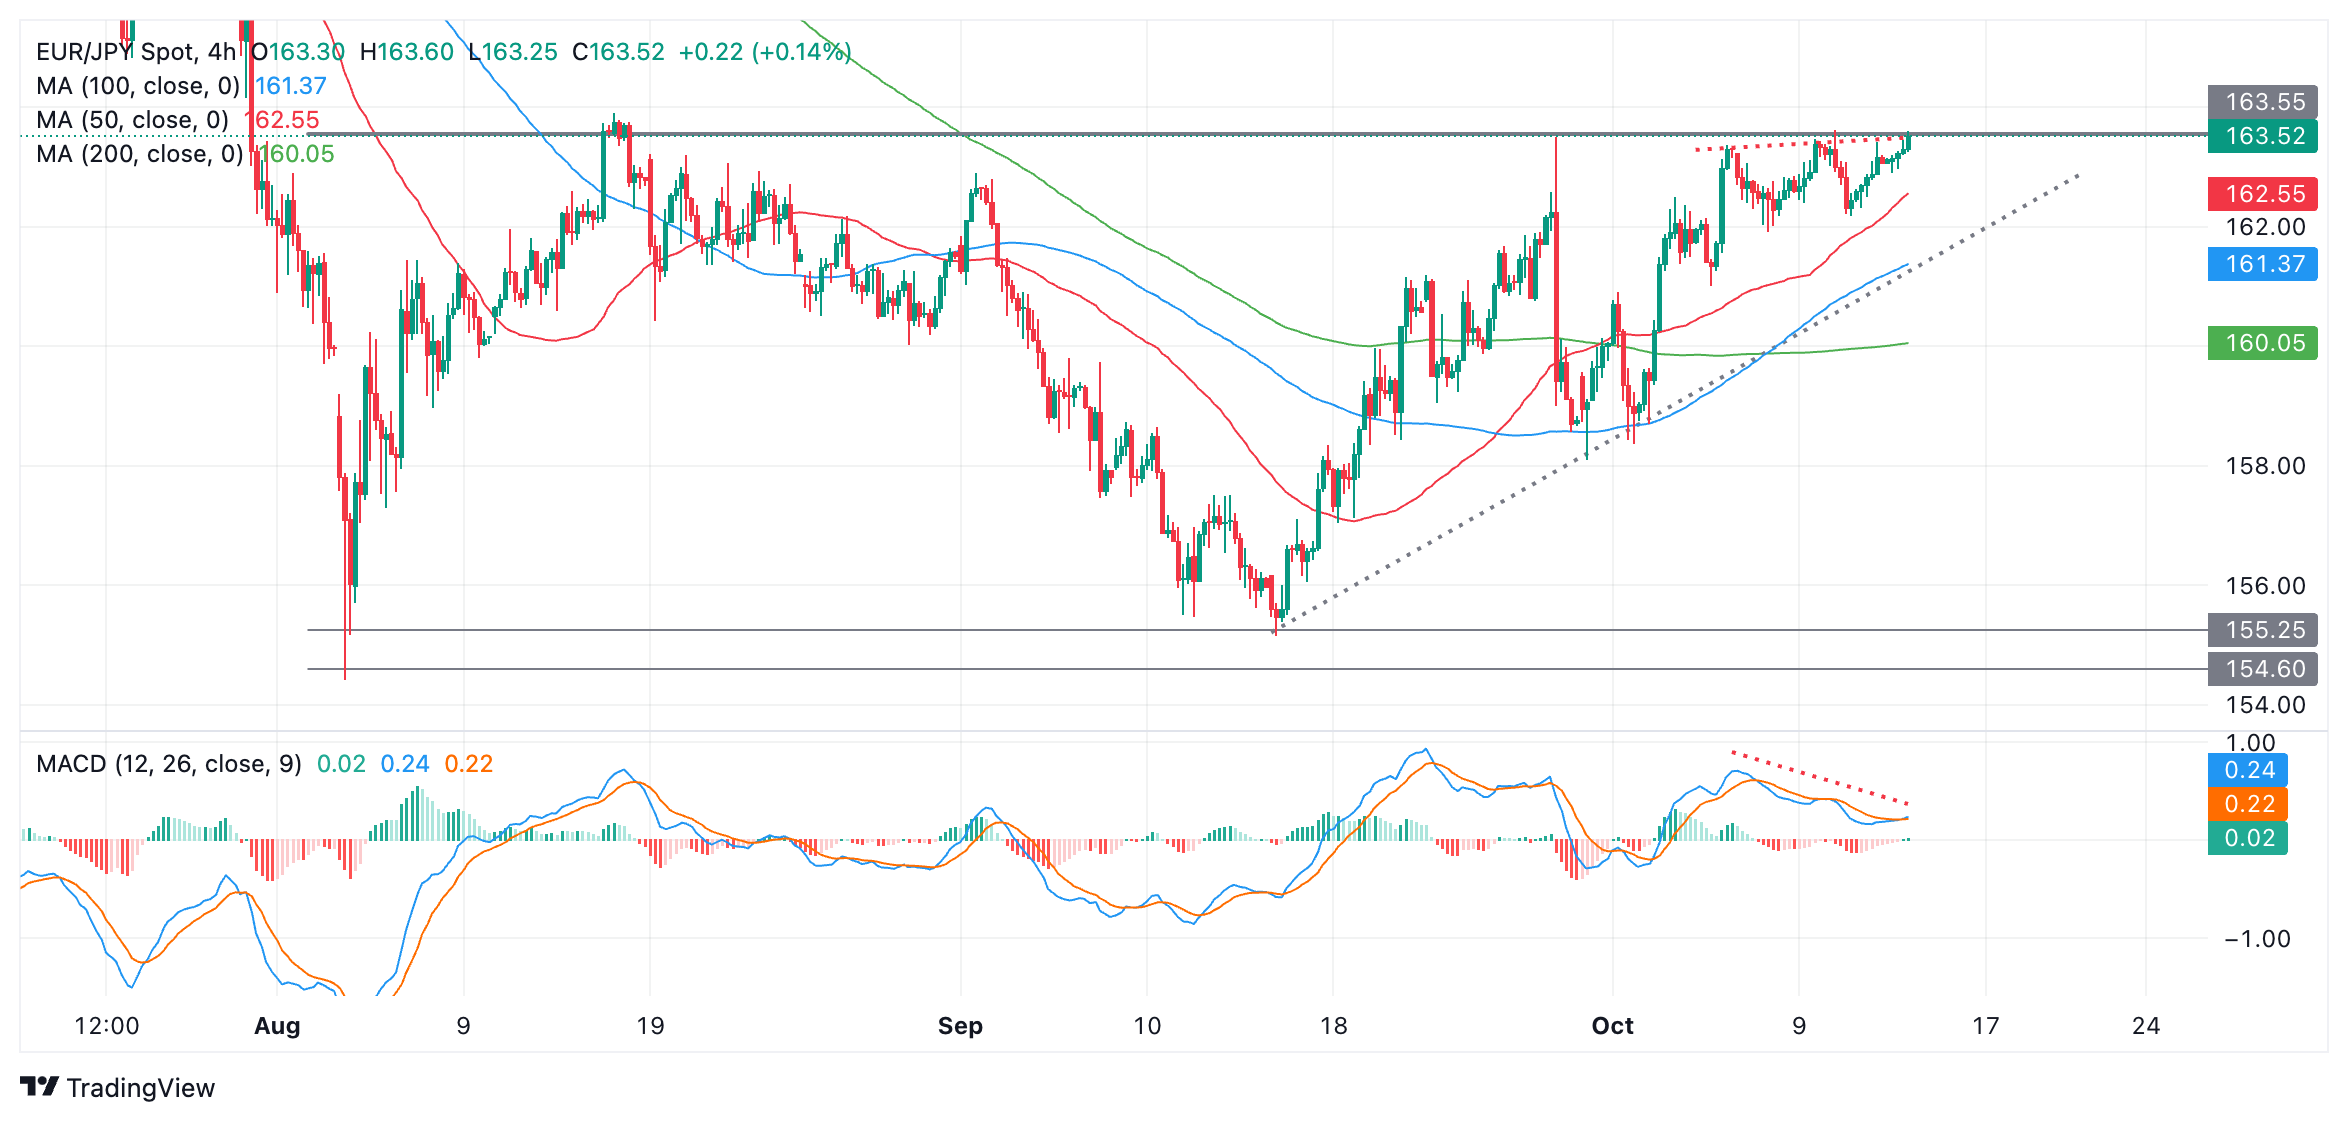
Given the principle of technical analysis that “the trend is your friend” the odds favor a continuation of this sideways mode. If so, then the next move for EUR/JPY will probably be a decline back down towards the range floor in the 154s. 

There are no reversal signs from the actual price yet, however, and it is too early to say with any confidence if the pair will break lower. A move below 161.91 (October 8 low) would be required to supply the additional bearish confirmation. For stronger confirmation price must break below the trendline for the up leg at around 161.70 (dotted black line on chart). The next downside target for EUR/JPY would be at about 158.32 – the October 1 as well as September 30 lows.

The Moving Average Convergence Divergence (MACD) momentum indicator is diverging bearishly with price (red dotted lines on chart). Whilst price is making higher highs, MACD is  declining. This is further evidence a downside move could be about to unfold.

On the other hand, a decisive break above the range highs would indicate a breakout of the range and the evolution of a new short-term uptrend. A decisive move would be one characterized by a longer-than-average green candlestick which cleared the range high and closed near its high, or three green candles in a row breaking above the top of the range.


Disclaimer: For information purposes only. Past performance is not indicative of future results.
placeholder
Bitcoin Bottom Debate: $70,000 or $50,000? Where is the Bitcoin bottom? Can you buy the dip now? Cathie Wood suggests swapping gold for Bitcoin.On Tuesday (February 3), panic in the crypto market eased as Bitcoin ( BTC) prices reb
Author  TradingKey
13 hours ago
Where is the Bitcoin bottom? Can you buy the dip now? Cathie Wood suggests swapping gold for Bitcoin.On Tuesday (February 3), panic in the crypto market eased as Bitcoin ( BTC) prices reb
placeholder
Bitcoin Reaches ‘Fire-Sale’ Valuations as ETF Outflows Jump, Says BitwiseBitcoin’s two-year rolling MVRV z-score has dropped to its lowest level ever, pointing to extreme undervaluation.
Author  Mitrade
13 hours ago
Bitcoin’s two-year rolling MVRV z-score has dropped to its lowest level ever, pointing to extreme undervaluation.
placeholder
Analyst Flags XRP as Market’s ‘Best Risk/Reward’ Play as Token Tests Critical $1.60 SupportCrypto analyst Scott Melker identifies a prime risk/reward setup for XRP as it tests key support at $1.60, offering a tight stop-loss against potential upside targets near $2.00.
Author  Mitrade
17 hours ago
Crypto analyst Scott Melker identifies a prime risk/reward setup for XRP as it tests key support at $1.60, offering a tight stop-loss against potential upside targets near $2.00.
placeholder
Bitcoin Slips Below 75,000 Mark. Will Strategy Change Its Mind and Sell?Bitcoin prices briefly fell below $75,000, hitting a new 10-month low, though the probability of continued short-term downside remains low.On Monday (February 12), the cryptocurrency mark
Author  TradingKey
Yesterday 10: 47
Bitcoin prices briefly fell below $75,000, hitting a new 10-month low, though the probability of continued short-term downside remains low.On Monday (February 12), the cryptocurrency mark
placeholder
Bitcoin Faces Risk of Deeper Losses as Price Action Echoes Past Bear MarketsBitcoin price targets remain bearish as it struggles near multi-month lows, influenced by historical bear market trends.
Author  Mitrade
Yesterday 10: 22
Bitcoin price targets remain bearish as it struggles near multi-month lows, influenced by historical bear market trends.
Related Instrument
goTop
quote