AUD/USD stuck near 0.6600 ahead of Australian CPI

Source Fxstreet
  • AUD/USD continues to cycle around the 0.6600 handle.
  • Aussie CPI print for Q4 2023 expected to show further inflation easing.
  • US Fed rate call, NFP labor figures to weigh down the rest of the trading week.

AUD/USD cycled in a familiar pattern around the 0.6600 price point on Tuesday as Antipodeans gear up for a fresh print of Australian Consumer Price Index (CPI) inflation figures with the next rate call from the US Federal Reserve (Fed0 in the barrel for Wednesday and US Nonfarm Payrolls (NFP) labor figures slated for Friday.

Australia’s QoQ CPI is expected to ease back to 0.8% from the previous quarter’s 1.2%, and the Reserve Bank of Australia’s (RBA) Trimmed Mean CPI for the annualized fourth quarter is likewise forecast to clip down from 5.2% to 4.3%.

Australia Monthly CPI Preview: Inflation expected to ease further

The heavy-hitters this week revolve around a one-two punch of another Fed rate call and Friday’s US NFP labor print. The Fed is broadly expected to keep rates on hold this week, but cut-hungry investors are having a hard time letting go of bets for a March rate cut, with 44% of the rate swap market still hoping for a rate cut by March according to the CME’s FedWatch Tool.

This week’s US NFP print is expected to show a slight cooling in US labor markets, with the NFP forecast to come in at 180K in January compared to December’s 216K. Markets have routinely undershot NFP forecasts recently, and a topside upset could see investors suffering a rate tantrum as a stubbornly-healthy US labor market reduces chances of rate cuts happening sooner rather than later.

AUD/USD technical outlook

AUD/USD continues to get hung up on the 0.6600 handle, with intraday price action cycling the major price level with near-term momentum getting propped up by a bullish tilt in the 200-hour Simple Moving Average (SMA) rising into 0.6590.

Daily candlesticks remain underpinned by the 200-day SMA at 0.6570, and the AUD/USD is caught in a dense congestion zone between the 50-day and 200-day SMAs as the pair consolidates into the midrange.

AUD/USD Hourly chart
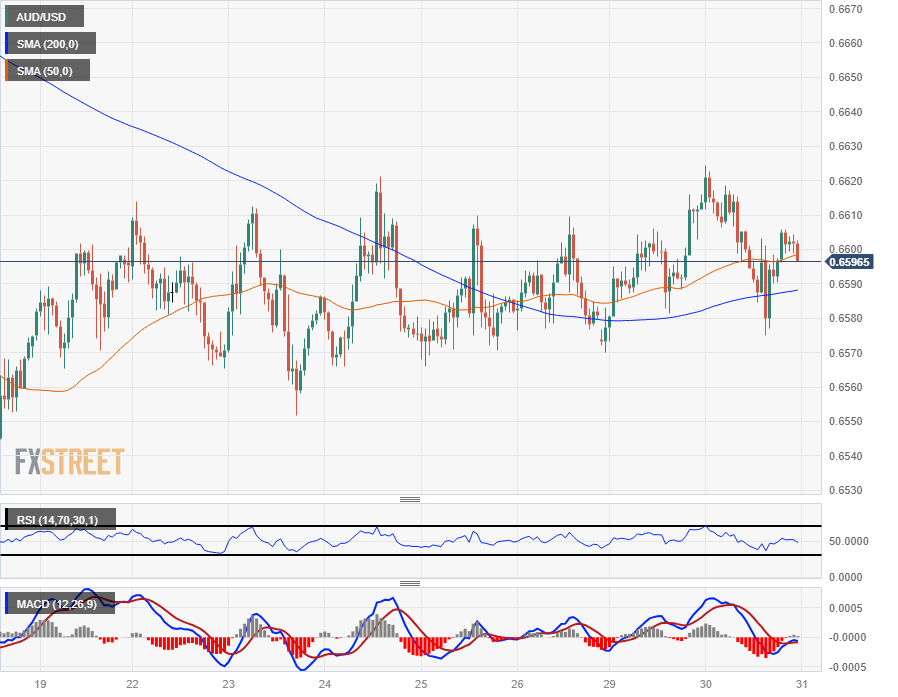
AUD/USD Daily chart


Disclaimer: For information purposes only. Past performance is not indicative of future results.
placeholder
Crypto Weekly Radar: All eyes on Donald Trump’s ultimatum, US macroeconomic dataCrypto markets begin the week with mixed sentiment, with Bitcoin (BTC) trading above $69,000 following last week’s rebound. Still, markets remain cautious as traders weigh risks stemming from Donald Trump’s renewed threats toward Iran ahead of the ultimatum set for Tuesday.
Author  FXStreet
9 hours ago
Crypto markets begin the week with mixed sentiment, with Bitcoin (BTC) trading above $69,000 following last week’s rebound. Still, markets remain cautious as traders weigh risks stemming from Donald Trump’s renewed threats toward Iran ahead of the ultimatum set for Tuesday.
placeholder
WTI eases below $103.50 as US, Iran reportedly seeking 45-day ceasefireWest Texas Intermediate (WTI), the US crude oil benchmark, is trading around $103.30 during the early European trading hours on Monday. The WTI price retreats after reports that the United States (US) and Iran are making a push for a 45-day ceasefire. 
Author  FXStreet
10 hours ago
West Texas Intermediate (WTI), the US crude oil benchmark, is trading around $103.30 during the early European trading hours on Monday. The WTI price retreats after reports that the United States (US) and Iran are making a push for a 45-day ceasefire. 
placeholder
Gold under pressure as fears mount, $4,600 support at risk Spot Gold gapped marginally lower at the weekly opening, with the XAU/USD pair battling to retain the $4,600 mark early in the Asian session.
Author  TradingKey
17 hours ago
Spot Gold gapped marginally lower at the weekly opening, with the XAU/USD pair battling to retain the $4,600 mark early in the Asian session.
placeholder
Gold Second-Quarter Outlook: Safe-Haven Failure or Pricing Logic Reshaping? Can Gold Enter a Major Rally?In the first quarter of 2026, gold prices experienced a classic "roller-coaster" ride. Against a macroeconomic backdrop of escalating geopolitical conflicts, gold prices briefly broke thr
Author  TradingKey
Apr 03, Fri
In the first quarter of 2026, gold prices experienced a classic "roller-coaster" ride. Against a macroeconomic backdrop of escalating geopolitical conflicts, gold prices briefly broke thr
placeholder
Spot Crude Oil Breaks $140. First Time Since 2008. Oil Market’s Most Severe Shock in History Is Here. On Thursday, April 2, Dated Brent crude prices reached $141.37 per barrel, the highest level since 2008, surpassing the peak set during the outbreak of the Russia-Ukraine conflict in 2022
Author  TradingKey
Apr 03, Fri
On Thursday, April 2, Dated Brent crude prices reached $141.37 per barrel, the highest level since 2008, surpassing the peak set during the outbreak of the Russia-Ukraine conflict in 2022
Related Instrument
goTop
quote