EUR/AUD Price Forecast: Possibility that new up leg is unfolding within range

Source Fxstreet
  • EUR/AUD could be forming a new up leg after bottoming at the start of the month. 
  • It has formed various reversal patterns and signals that point to a likely extension higher.


EUR/AUD bottomed out at 1.6000 and started rising last week, recovering back up to the 1.6300s before pulling back to where it is currently consolidating in the 1.62s. 

EUR/AUD Daily Chart 

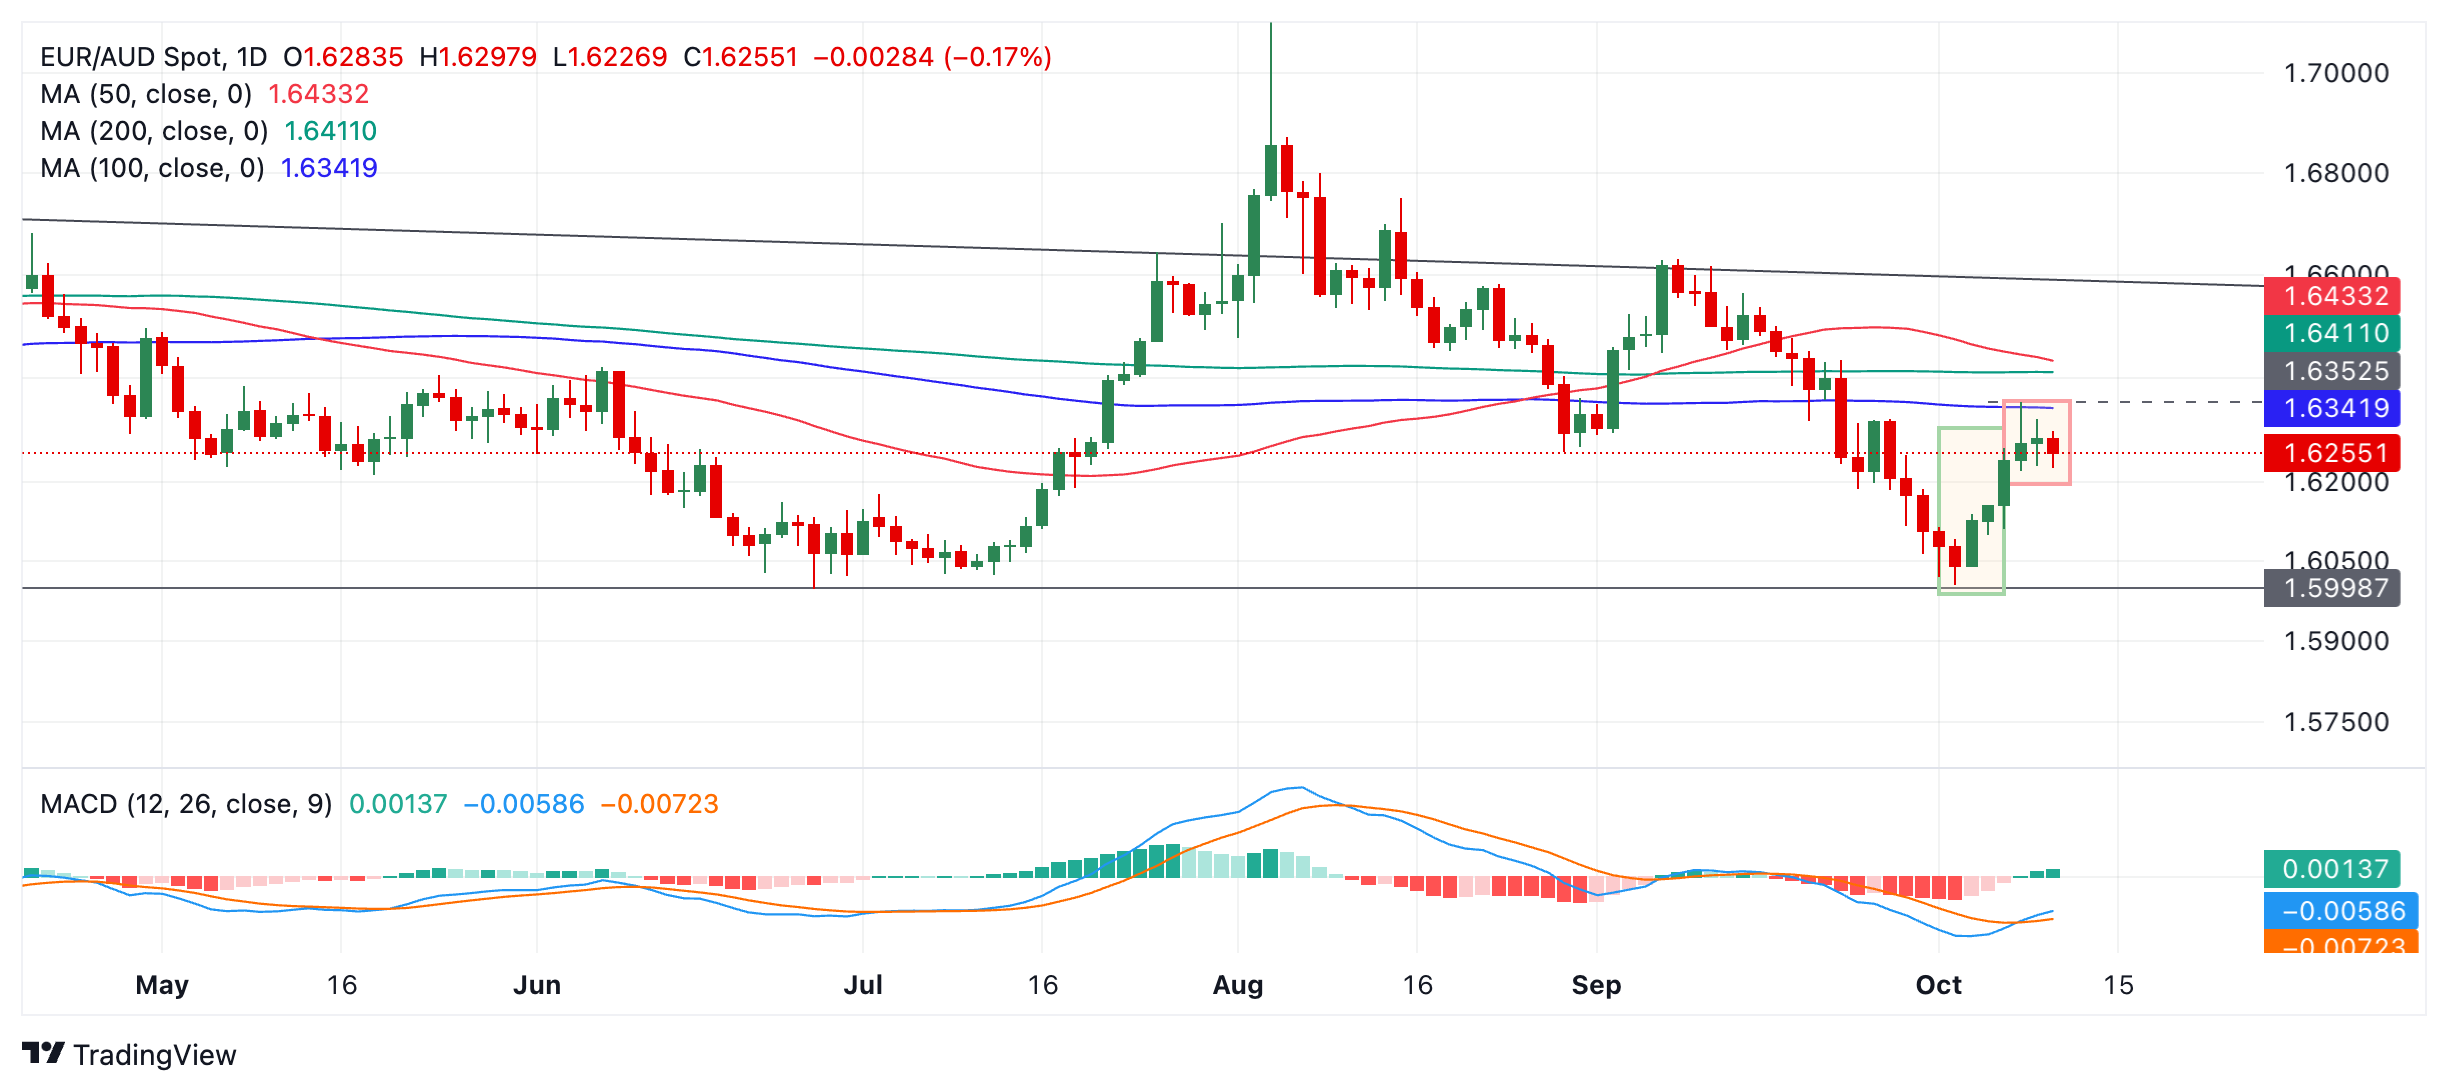
It is possible this is the start of a new leg higher within a long-term range that stretches from a floor at about 1.6000 and a sloping ceiling currently in the 1.65s. If so, then prices will probably continue higher. 

A break above Tuesday’s high of 1.6354 would likely indicate a continuation to the red 50-day Simple Moving Average (SMA) at 1.6433.  A break above that, would probably lead to a move up to the top of the range at around 1.6550. 

The blue Moving Average Convergence Divergence (MACD) momentum indicator has crossed above its red signal line, giving a buy signal and adding to the bullish evidence.

EUR/AUD formed a bullish Three White Soldiers Japanese candlestick pattern after the October 3 bottom (green shaded rectangle on chart), indicating a possible reversal of the short-term trend. This occurs after a downtrend when three up days form consecutively. 

Although the pair formed a bearish Shooting Star candlestick on Tuesday after the market peaked and then fell back down to near its open, the day ended green and not red lessening its bearish significance. It was also not followed by a down day immediately after which would have given added bearish confirmation (red-shaded rectangle on chart).


Disclaimer: For information purposes only. Past performance is not indicative of future results.
placeholder
Bitcoin Suffers Year’s Strongest Waterfall-Style Decline. Will It Next Drop to the $60,000 Mark?During the Asian trading session on June 4, Bitcoin continued its multi-day slump, briefly dropping below the $62,000 mark to $61,338. As of press time, Bitcoin was trading at $63,844, wi
Author  TradingKey
12 hours ago
During the Asian trading session on June 4, Bitcoin continued its multi-day slump, briefly dropping below the $62,000 mark to $61,338. As of press time, Bitcoin was trading at $63,844, wi
placeholder
Bitcoin drops below $65K amid reinforced bear market signalsBitcoin (BTC) dipped further below $65,000 on Wednesday, with onchain data from Glassnode signaling a market firmly in a bear phase. The decline has pushed prices back into a key valuation range between the Realized Price and the True Market Mean.
Author  FXStreet
20 hours ago
Bitcoin (BTC) dipped further below $65,000 on Wednesday, with onchain data from Glassnode signaling a market firmly in a bear phase. The decline has pushed prices back into a key valuation range between the Realized Price and the True Market Mean.
placeholder
Forex Today: US Dollar stays resilient ahead of key US dataHere is what you need to know on Wednesday, June 3:
Author  FXStreet
Yesterday 10: 27
Here is what you need to know on Wednesday, June 3:
placeholder
$1.5 Billion in Crypto Assets Liquidated, Bitcoin Falls Below $66,000 Mark. What Is the Reason?On June 2, Eastern Time, the cryptocurrency market suffered its most severe wave of concentrated liquidations so far this year. Bitcoin ( BTC) fell below the $70,000 psychological support
Author  TradingKey
Yesterday 06: 32
On June 2, Eastern Time, the cryptocurrency market suffered its most severe wave of concentrated liquidations so far this year. Bitcoin ( BTC) fell below the $70,000 psychological support
placeholder
WTI rises to near $93.00 as Iran launches missiles toward Kuwait, BahrainWest Texas Intermediate (WTI) gains ground for the third successive day, trading around $92.90 per barrel during the Asian hours on Wednesday.
Author  FXStreet
Yesterday 01: 24
West Texas Intermediate (WTI) gains ground for the third successive day, trading around $92.90 per barrel during the Asian hours on Wednesday.
Related Instrument
goTop
quote