NZD/JPY Price Analysis: Bulls await near-term break, neutral outlook

Source Fxstreet
  • NZD/JPY continues to trade within a range, just below 91.00.
  • RSI retreats towards 50, MACD flat, indicating neutral momentum.
  • A decisive breakout above 91.00 could extend gains toward 92.00.

The NZD/JPY pair pulled back on Monday, declining by 0.80% to 90.70, but it continues to side-ways trade between 91.00 and 90.00.

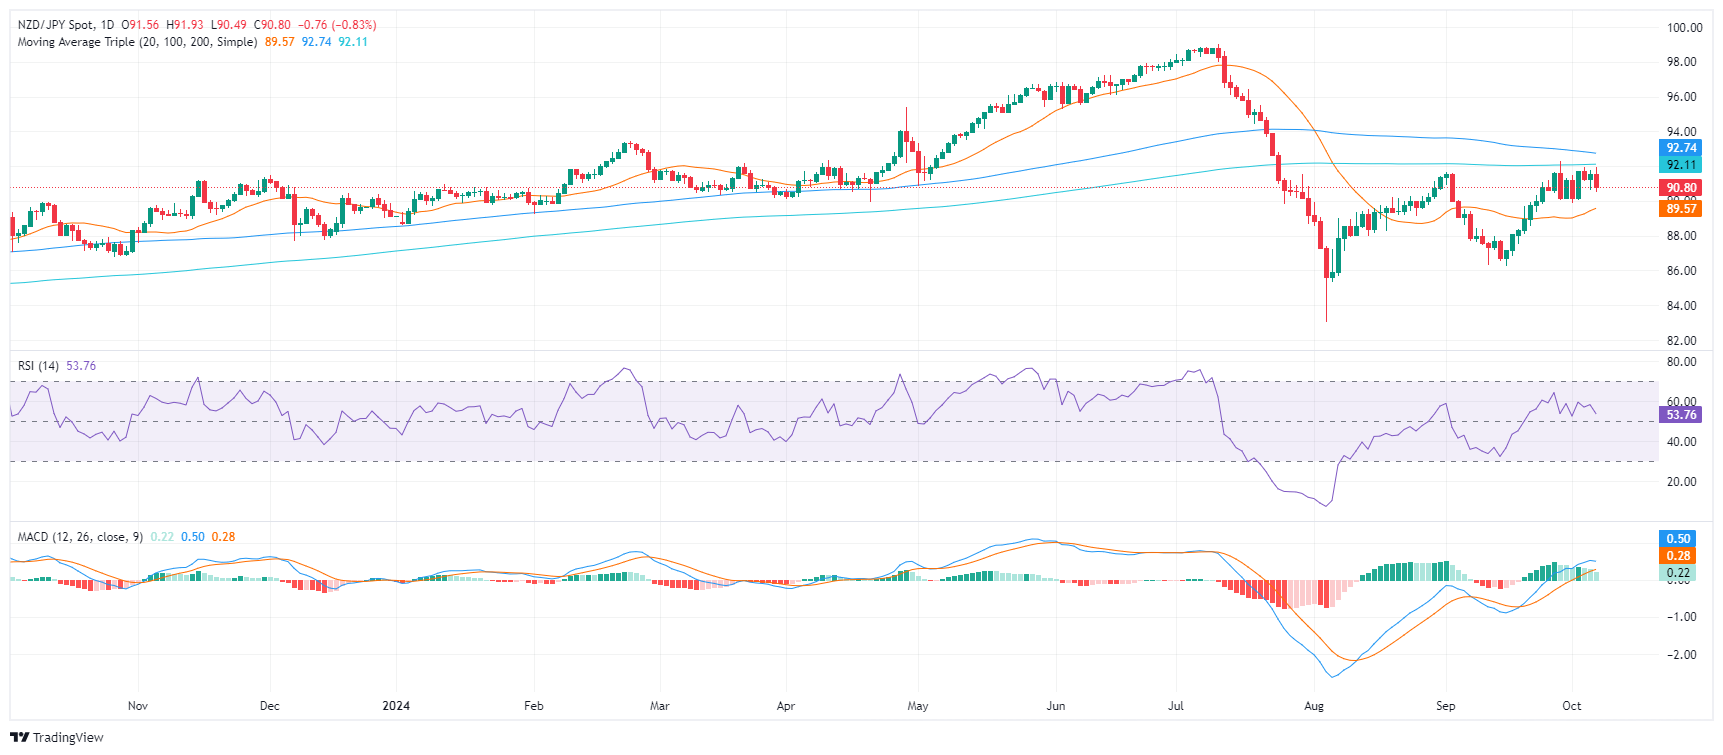
The Relative Strength Index (RSI) is currently at 53, which is in the positive area. However, the RSI has been declining sharply, which suggests that buying pressure is declining. The MACD is currently flat and green, which suggests that buying pressure is flat and that there is no clear trend in the pair.

The NZD/JPY pair has been trading within a range for the past seven sessions, after an upwards spike on October 2. The pair is currently trading around 90.70, near the middle of the range. Support levels are seen at 90.30, 90.15, and 90.00, while resistance levels are at 91.00, 91.50, and 92.00. In the short-term, the outlook seems to be neutral, but as the pair trades below the 100 and 200-day Simple Moving Averages (SMA) it paints the trend with bearishness.

NZD/JPY daily chart

Disclaimer: For information purposes only. Past performance is not indicative of future results.
placeholder
Bitcoin Drops Below $70,000 as Crypto Rally Fails to MaterializeThe crypto market experienced a significant pullback, Bitcoin (BTCUSD) fell below the key $70,000 mark during intraday trading, triggering short-term stop-loss orders and causing market s
Author  TradingKey
7 hours ago
The crypto market experienced a significant pullback, Bitcoin (BTCUSD) fell below the key $70,000 mark during intraday trading, triggering short-term stop-loss orders and causing market s
placeholder
Gold falls below $4,850 as Fed holds rates steadyGold price (XAU/USD) faces some selling pressure near $4,830 during the early Asian session on Thursday.
Author  FXStreet
15 hours ago
Gold price (XAU/USD) faces some selling pressure near $4,830 during the early Asian session on Thursday.
placeholder
WTI Crude Prices Capped at $100, Has the Rally Ended? How to Trade the Short Term? Today (March 18), WTI crude oil continued to exhibit significant short-term volatility, driven by a tug-of-war between headlines and data. Intraday, prices retreated from Tuesday's high o
Author  TradingKey
Yesterday 10: 33
Today (March 18), WTI crude oil continued to exhibit significant short-term volatility, driven by a tug-of-war between headlines and data. Intraday, prices retreated from Tuesday's high o
placeholder
Silver Price Forecast: XAG/USD consolidates above $79.00; bearish bias intact ahead of FedSilver (XAG/USD) lacks a firm intraday direction and oscillates in a narrow range during the Asian session on Wednesday as traders opt to wait on the sidelines ahead of the crucial FOMC rate decision.
Author  FXStreet
Yesterday 02: 16
Silver (XAG/USD) lacks a firm intraday direction and oscillates in a narrow range during the Asian session on Wednesday as traders opt to wait on the sidelines ahead of the crucial FOMC rate decision.
placeholder
WTI rises above $95.00 as Iran's attacks on facilities fuel supply fearsWest Texas Intermediate (WTI), the US crude oil benchmark, is trading around $95.00 during the early Asian trading hours on Wednesday. The WTI price climbs amid intensifying Middle East conflict and severe supply disruptions.
Author  FXStreet
Yesterday 01: 29
West Texas Intermediate (WTI), the US crude oil benchmark, is trading around $95.00 during the early Asian trading hours on Wednesday. The WTI price climbs amid intensifying Middle East conflict and severe supply disruptions.
Related Instrument
goTop
quote