

USD/JPY Price Forecast: Snaps three-day rally, tumbles below 148.50
- USD/JPY retreats after failing to extend its rally, despite US 10-year Treasury yield rising five basis points.
- Technical outlook remains upward biased, with buyers eyeing a break above 149.14 and targeting 150.00 in the short term.
- A drop below 148.00 could see further downside, with key support at 147.00 and the bottom of the Ichimoku Cloud at 146.87.
The USD/JPY retreated after rallying for three straight days, even though the US 10-year Treasury noy yield rose five basis points. Risk aversion drives price action as the Middle East war escalates amid an exchange of fire between Israel, Hezbollah, and Hamas. At the time of writing, the pair trades at 148.12 after hitting a daily peak of 149.14.
USD/JPY Price Forecast: Technical outlook
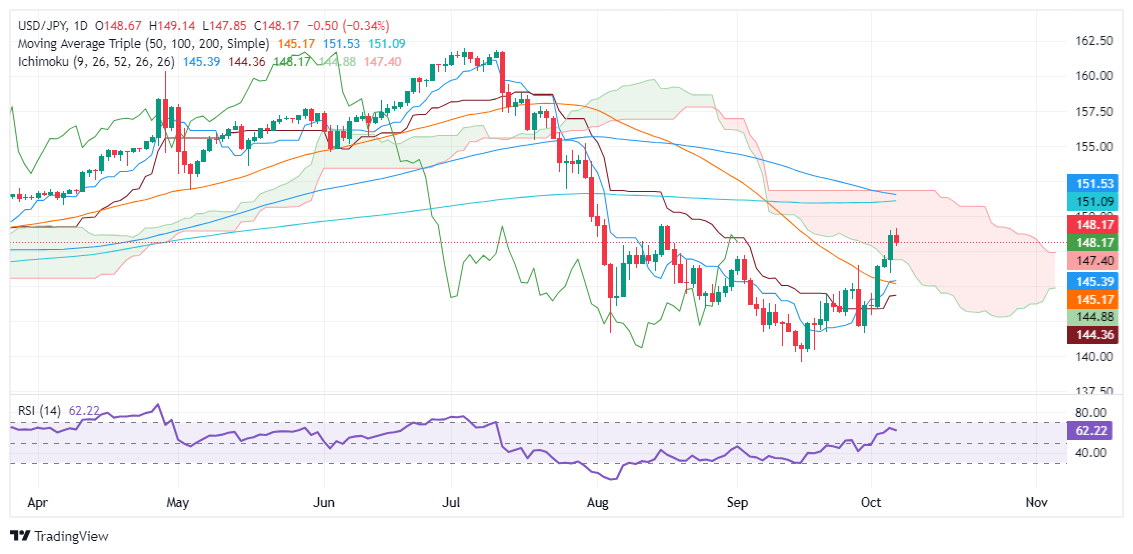
The USD/JPY failed to extend its uptrend after piercing inside the Ichimoku Cloud (Kumo), which opened the door for further upside. Alongside that, the pair cleared the 50-day moving average (DMA) at 145.17, and since then, buyers have set their sights on 150.00.
Bullish momentum has faded, as shown by the Relative Strength Index (RSI) slope’s downward aiming. Still, the USD/JPY is upward biased in the short term.
Given the backdrop, the USD/JPY first resistance will be the 149.14 daily high of October 7. Once surpassed, the next stop would be 150.00. If those levels are surrendered, bulls could challenge the 200-DMA at 151.09.
Conversely, if the pair drops below 148.00, bears can drag the exchange rate towards 147.00 as they would like to drive prices toward the latest key support, the bottom of Kumo at 146.87.
USD/JPY Price Action – Daily Chart
Japanese Yen PRICE Today
The table below shows the percentage change of Japanese Yen (JPY) against listed major currencies today. Japanese Yen was the strongest against the New Zealand Dollar.
| USD | EUR | GBP | JPY | CAD | AUD | NZD | CHF | |
|---|---|---|---|---|---|---|---|---|
| USD | -0.02% | 0.24% | -0.37% | 0.36% | 0.52% | 0.56% | -0.48% | |
| EUR | 0.02% | 0.33% | -0.29% | 0.41% | 0.52% | 0.57% | -0.49% | |
| GBP | -0.24% | -0.33% | -0.68% | 0.10% | 0.20% | 0.28% | -0.70% | |
| JPY | 0.37% | 0.29% | 0.68% | 0.72% | 0.88% | 0.88% | -0.08% | |
| CAD | -0.36% | -0.41% | -0.10% | -0.72% | 0.19% | 0.18% | -0.84% | |
| AUD | -0.52% | -0.52% | -0.20% | -0.88% | -0.19% | 0.09% | -0.97% | |
| NZD | -0.56% | -0.57% | -0.28% | -0.88% | -0.18% | -0.09% | -1.00% | |
| CHF | 0.48% | 0.49% | 0.70% | 0.08% | 0.84% | 0.97% | 1.00% |
The heat map shows percentage changes of major currencies against each other. The base currency is picked from the left column, while the quote currency is picked from the top row. For example, if you pick the Japanese Yen from the left column and move along the horizontal line to the US Dollar, the percentage change displayed in the box will represent JPY (base)/USD (quote).
Recommended Articles


