AUD/USD Price Forecast: Falls back inside range signaling possible bearish reversal

Source Fxstreet
  • AUD/USD stalls at upside resistance and reverses lower, falling back inside its range. 
  • It is threatening a short-term trend reversal and MACD is about to cross below its signal line. 

AUD/USD reverses and starts falling after what appears to be a false breakout above the top of the range. 

AUD/USD Daily Chart 

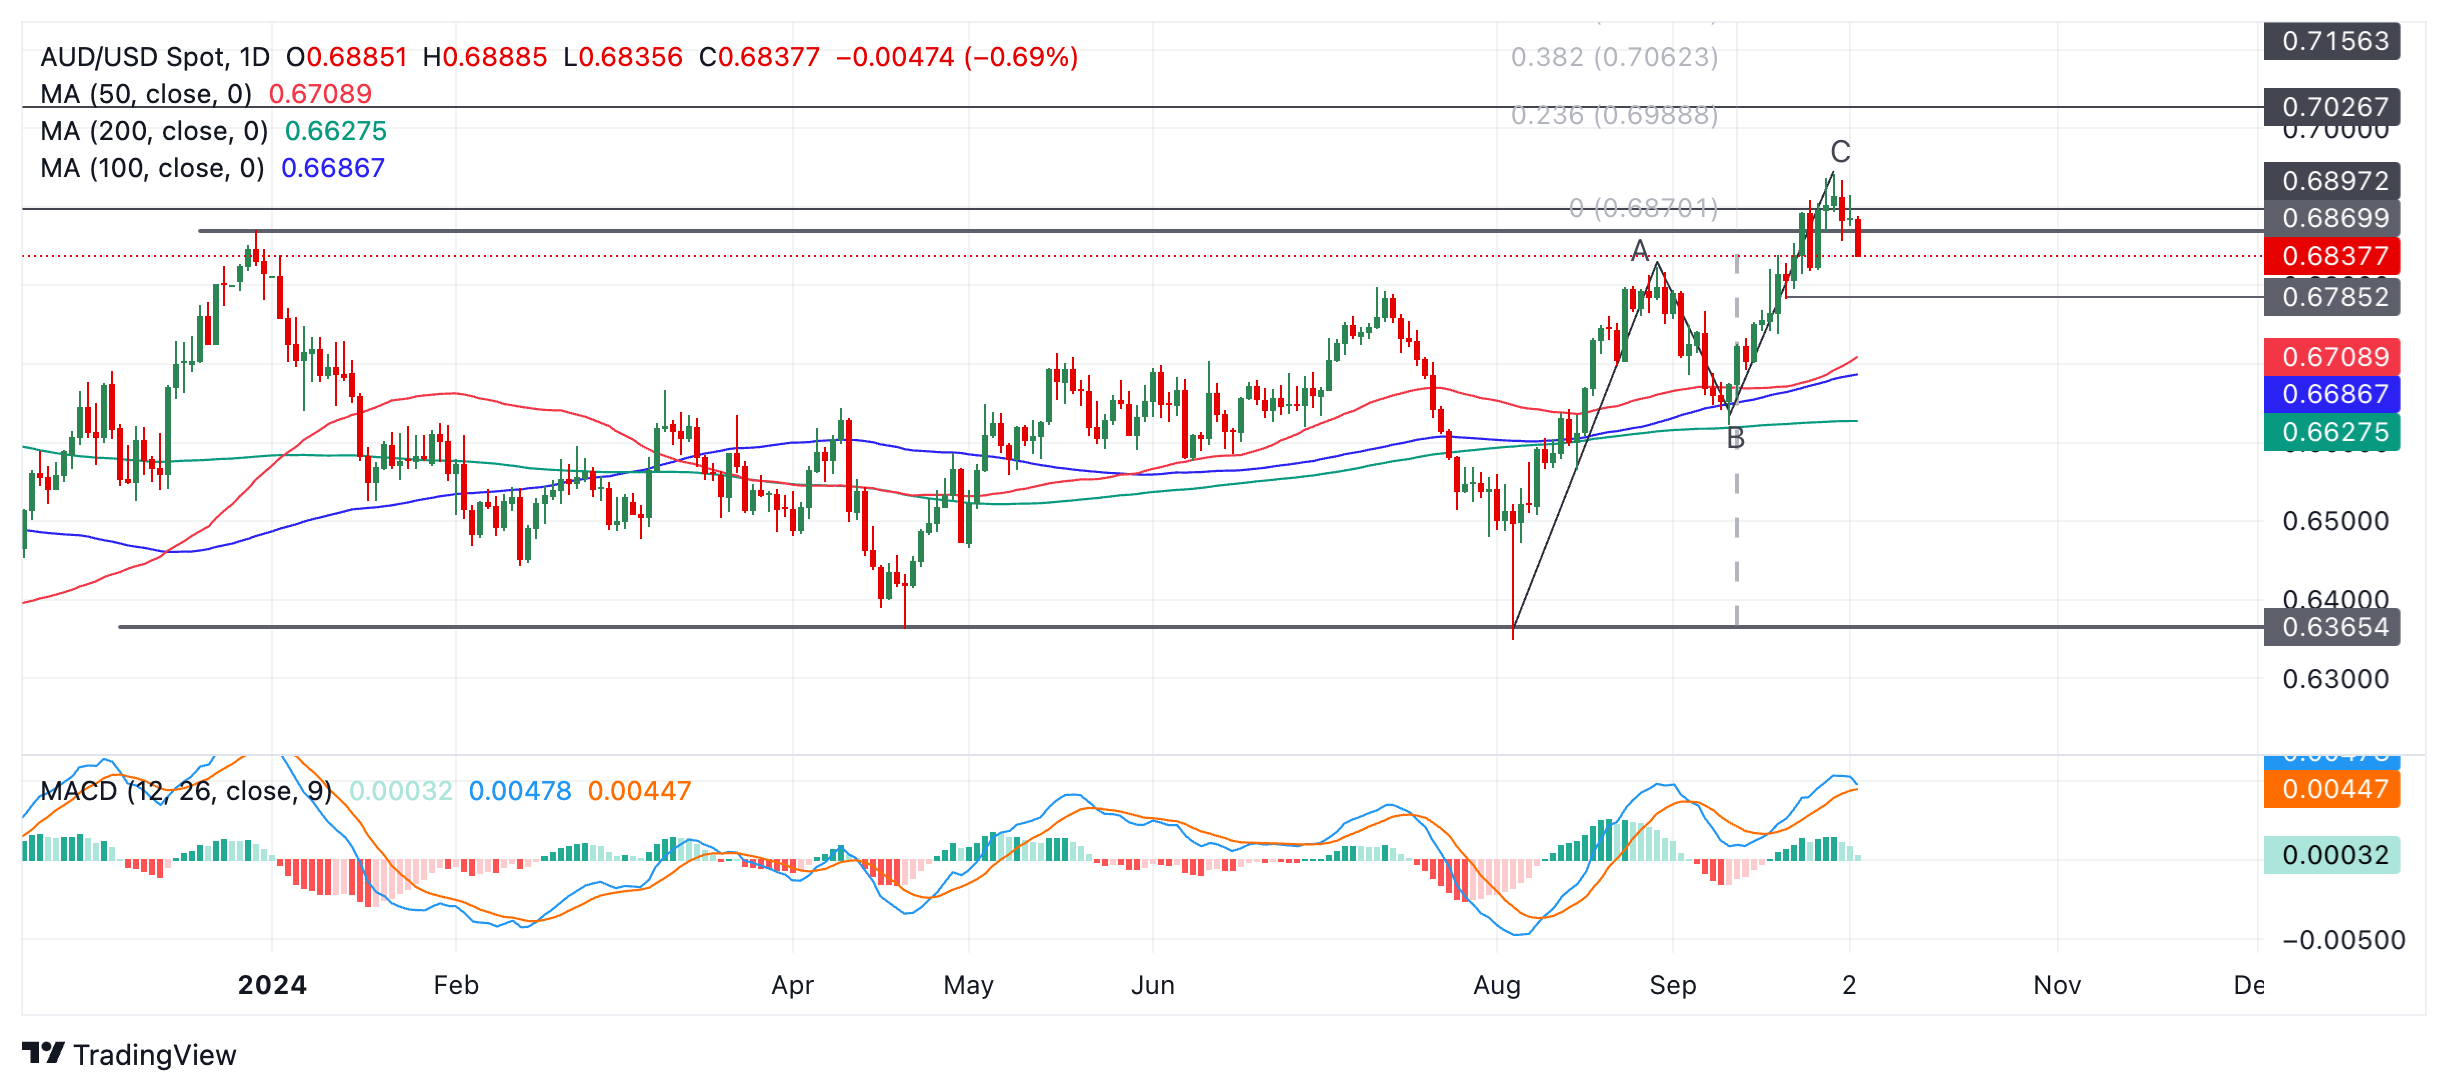
The Aussie pair has now started falling back inside the range. It is possible this could be the start of a new short-term downtrend that might take AUD/USD back down towards the range lows in the 0.63s, however, it is still too early to say with any confidence.  

The blue Moving Average Convergence Divergence (MACD) line is threatening to cross below the red signal line and if it does that would add further evidence to the argument that AUD/USD is reversing trend. 

AUD/USD may have formed a Measured Move pattern during August and September as it rose from the bottom to the top of the range. Such patterns resemble zig-zags and lengths of waves A and C are similar or related by Fibonacci.  

The Aussie pair reached an initial upside target based on extrapolating wave A of the Measured Move higher by a 61.8% Fibonacci. This target lies at around 0.6115. This is further evidence the uptrend may have reached its zenith and a new downtrend is currently forming. For more confirmation price would have to break below the 0.6785 level (September 20 swing low). Such a move would be expected to reach an initial downside target of 0.6709, the level of the 50-day Simple Moving Average (SMA). 

Until then, there is still a risk the move down could stall and the uptrend resume, taking AUD/USD higher again. A break above the 0.6942 September 30 peak would confirm a resumption of the uptrend and target 0.6988 (14 February ‘23 swing high), followed by 0.7156 in a bullish case (2 February ‘23 high).


Disclaimer: For information purposes only. Past performance is not indicative of future results.
placeholder
Bitcoin Price Annual Forecast: 2025 outlook brightens on expectations of US pro-crypto policyBitcoin (BTC) price has surged more than 140% in 2024, reaching the $100K milestone in early December.
Author  FXStreet
Dec 19, 2024
Bitcoin (BTC) price has surged more than 140% in 2024, reaching the $100K milestone in early December.
placeholder
Bitcoin ETF Inflows For 2025 Now Outpace 2024, Data ShowsUS Bitcoin spot exchange-traded funds (ETFs) have seen more inflows this year so far compared to the same point in 2024, according to data.
Author  Bitcoinist
Jul 16, Wed
US Bitcoin spot exchange-traded funds (ETFs) have seen more inflows this year so far compared to the same point in 2024, according to data.
placeholder
Litecoin Price Forecast: LTC breaks above bullish technical pattern, targets $170 markLitecoin (LTC) price is showing renewed bullish strength after breaking out of an ascending channel pattern, trading above $133 at the time of writing on Wednesday.
Author  FXStreet
Aug 13, Wed
Litecoin (LTC) price is showing renewed bullish strength after breaking out of an ascending channel pattern, trading above $133 at the time of writing on Wednesday.
placeholder
Gold Price Forecast: XAU/USD gains momentum to near $3,650, eyes on US CPI releaseThe Gold price (XAU/USD) gains momentum to near $3,645 during the early Asian session on Thursday.
Author  FXStreet
Sep 11, Thu
The Gold price (XAU/USD) gains momentum to near $3,645 during the early Asian session on Thursday.
placeholder
Silver Price Forecast: XAG/USD rises to near $48.50 as Fed rate cut bets increaseSilver price (XAG/USD) gains ground after recovering losses registered in the previous session, trading around $48.40 per troy ounce during the Asian hours on Friday.
Author  FXStreet
Nov 07, Fri
Silver price (XAG/USD) gains ground after recovering losses registered in the previous session, trading around $48.40 per troy ounce during the Asian hours on Friday.
Related Instrument
goTop
quote