USD/CAD Price Forecast: Tests 21-day Exponential Moving Average near 1.3550

Source Fxstreet
  • The USD/CAD pair tests 21-day EMA at 1.3534 level, followed by the upper boundary of an ascending channel at 1.3570.
  • If the 14-day RSI crosses above the 50 level, it could reinforce the bullish bias, indicating increasing upward momentum.
  • A break below the lower boundary of an ascending channel at 1.3490 could cause the emergence of the bearish bias.

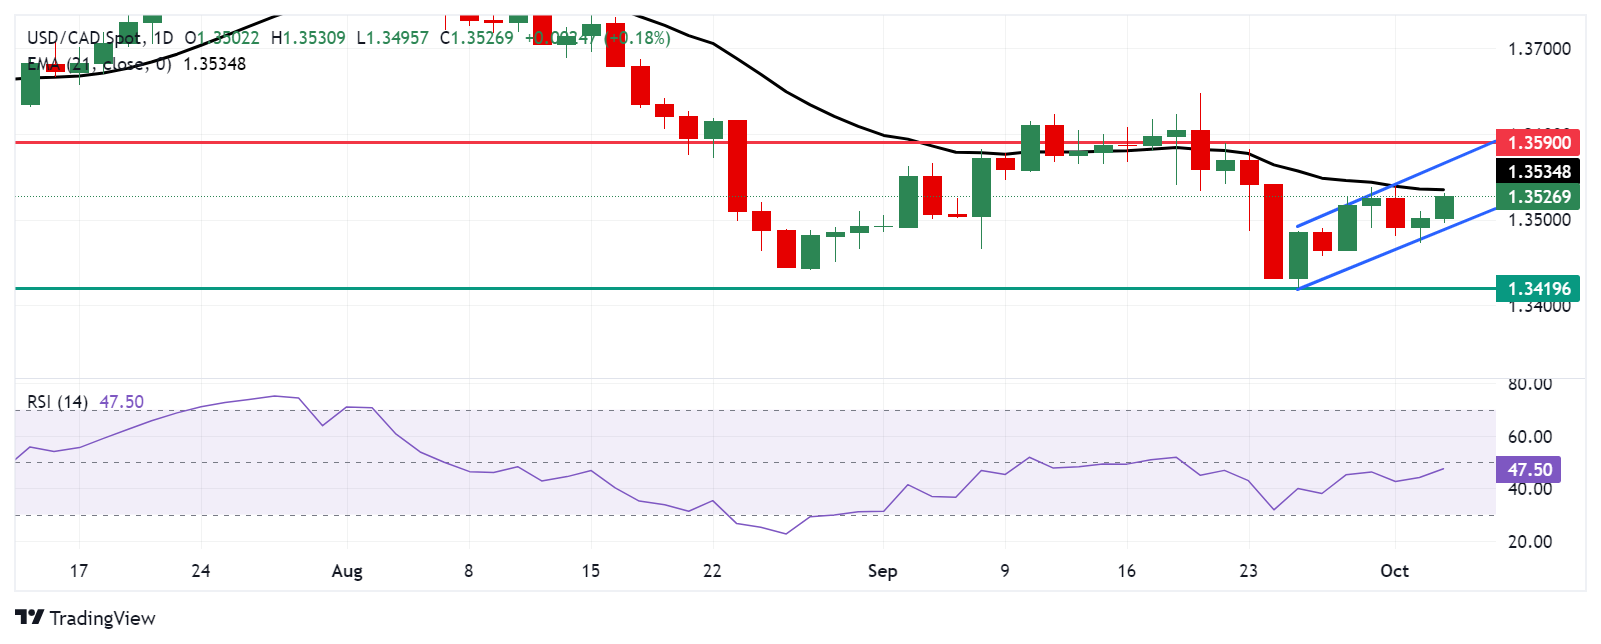
USD/CAD extends its gains for the second consecutive day, trading around 1.3530 during Thursday’s European hours. Analysis of the daily chart shows that the pair consolidates within the ascending channel, suggesting an ongoing bullish bias.

However, the 14-day Relative Strength Index (RSI) remains below the 50 level, indicating that the bearish trend is still in effect. A breach above the 50 mark would strengthen the ongoing bullish sentiment.

Regarding the upside, the immediate barrier appears at the 21-day Exponential Moving Average (EMA) at the 1.3534 level, followed by the upper boundary of an ascending channel at the 1.3570 level. A breach above the ascending channel would strengthen the bullish bias and lead the USD/CAD pair to test the "throwback support turns into a pullback resistance" level of 1.3590, followed by the psychological level of 1.3600.

On the downside, the USD/CAD may find support around the region around the lower boundary of an ascending channel at 1.3490. A break below this level could cause the emergence of the bearish bias and push the pair to test the eight-month low of 1.3418 level, recorded on September 25.

USD/CAD: Daily Chart


Canadian Dollar PRICE Today

The table below shows the percentage change of Canadian Dollar (CAD) against listed major currencies today. Canadian Dollar was the weakest against the US Dollar.

  USD EUR GBP JPY CAD AUD NZD CHF
USD   0.10% 0.97% 0.06% 0.18% 0.36% 0.53% 0.28%
EUR -0.10%   0.87% -0.03% 0.06% 0.26% 0.41% 0.18%
GBP -0.97% -0.87%   -0.89% -0.80% -0.61% -0.45% -0.67%
JPY -0.06% 0.03% 0.89%   0.13% 0.31% 0.43% 0.23%
CAD -0.18% -0.06% 0.80% -0.13%   0.18% 0.35% 0.11%
AUD -0.36% -0.26% 0.61% -0.31% -0.18%   0.15% -0.06%
NZD -0.53% -0.41% 0.45% -0.43% -0.35% -0.15%   -0.22%
CHF -0.28% -0.18% 0.67% -0.23% -0.11% 0.06% 0.22%  

The heat map shows percentage changes of major currencies against each other. The base currency is picked from the left column, while the quote currency is picked from the top row. For example, if you pick the Canadian Dollar from the left column and move along the horizontal line to the US Dollar, the percentage change displayed in the box will represent CAD (base)/USD (quote).

Disclaimer: For information purposes only. Past performance is not indicative of future results.
placeholder
Fed Chair Candidate: What Would a Hassett Nomination Mean for U.S. Stocks?1. IntroductionOver the past month, investors' expectations for a Federal Reserve interest rate cut in December first cooled and then reignited. These fluctuating expectations have directly triggered
Author  TradingKey
11 hours ago
1. IntroductionOver the past month, investors' expectations for a Federal Reserve interest rate cut in December first cooled and then reignited. These fluctuating expectations have directly triggered
placeholder
Avalanche Coils for a Big Move as Wolfe Wave Pattern TightensAvalanche (AVAX) is trading near $13.06 as a Wolfe Wave pattern and key weekly trendline converge, with BeLaunch eyeing a $11–$8 accumulation zone and drawing parallels to the September 2023 setup — a combination that suggests a major breakout could be approaching once the current coil finally snaps.
Author  Mitrade
15 hours ago
Avalanche (AVAX) is trading near $13.06 as a Wolfe Wave pattern and key weekly trendline converge, with BeLaunch eyeing a $11–$8 accumulation zone and drawing parallels to the September 2023 setup — a combination that suggests a major breakout could be approaching once the current coil finally snaps.
placeholder
AUD/USD holds steady below 0.6550 as traders await Australian GDP releaseThe AUD/USD pair trades on a flat note near 0.6540 during the early Asian trading hours on Tuesday. Weaker-than-expected US economic data and rising US interest rate cut expectations in December drag the US Dollar (USD) lower against the Australian Dollar (AUD).
Author  FXStreet
19 hours ago
The AUD/USD pair trades on a flat note near 0.6540 during the early Asian trading hours on Tuesday. Weaker-than-expected US economic data and rising US interest rate cut expectations in December drag the US Dollar (USD) lower against the Australian Dollar (AUD).
placeholder
U.S. PCE and 'Mini Jobs' Data in Focus as Salesforce (CRM) and Snowflake (SNOW) Report Earnings 【The week ahead】 TradingKey - US stocks rebounded last week, ending a three-week slide, on rising expectations for a Federal Reserve rate cut in December. The market is now poised for further gains. This week, the Fe
Author  TradingKey
Yesterday 10: 12
 TradingKey - US stocks rebounded last week, ending a three-week slide, on rising expectations for a Federal Reserve rate cut in December. The market is now poised for further gains. This week, the Fe
placeholder
Crypto Market Outlook: Bitcoin, Ethereum, and XRP Tumble as BoJ Hawkishness Sparks Risk-Off RoutBitcoin slides below $87,000, Ethereum leans on $2,800 support and XRP hovers around $2.00 as December opens with a risk-off tone, leaving BTC eyeing $80,600–$74,508, ETH exposed to $2,111 and XRP to $1.90 unless buyers can turn key levels into a base for a rebound.
Author  Mitrade
Yesterday 06: 52
Bitcoin slides below $87,000, Ethereum leans on $2,800 support and XRP hovers around $2.00 as December opens with a risk-off tone, leaving BTC eyeing $80,600–$74,508, ETH exposed to $2,111 and XRP to $1.90 unless buyers can turn key levels into a base for a rebound.
goTop
quote