

GBP/USD touches 31-month high, Pound rally extends
- GBP/USD edged into a fresh multi-year high on Thursday.
- Despite a lack of UK data, GBP continues to grind higher.
- Better-than-expected US data keeps Greenback short pressure elevated.
The GBP/USD currency pair reached a 31-month high of 1.3434 on Thursday, marking a significant milestone in its upward trajectory. This surge was primarily driven by a widespread selloff of the US dollar, buoyed by improved economic indicators that alleviated concerns about a potential economic slowdown.
The data docket remains light on the UK side for the remainder of the week, and Cable traders will be forced to sit on their hands and wait for GBP-centric data due next week, starting with UK Gross Domestic Product (GDP) figure slated for Monday.
The Federal Reserve's recent decision to cut interest rates by 50 basis points raised apprehensions in global markets, with some investors fearing that the drastic move was a response to an impending economic downturn in the US. However, Fed Chair Jerome Powell clarified that the rate cut was a proactive measure aimed at supporting the US labor market, rather than a reactive response to recessionary signals.
Positive data on US Durable Goods Orders and weekly Initial Jobless Claims further reinforced the Fed's position, with both indicators surpassing expectations. The narrative of a "soft landing" for the economy remained intact. The upcoming release of the Personal Consumption Expenditure (PCE) inflation data on Friday will serve as a crucial litmus test for evaluating the impact of the recent rate cut by the Fed.
In August, US Durable Goods Orders stagnated at 0.0% month-on-month, falling short of the previous month's significant growth but still outperforming the projected contraction of 2.6%. Additionally, the Initial Jobless Claims for the week ending September 20 showed a decrease to 218K, beating the anticipated 225K and signaling a decline from the revised figure of 222K in the preceding week.
GBP/USD price forecast
The GBP/USD, also known as Cable, has been steadily reaching multi-year highs, and there are few significant technical obstacles in the way for Pound bulls. However, the strong upward momentum has made GBP/USD vulnerable to a possible downward correction as market dynamics come into play. If there is a significant buildup of selling pressure in the current price region, it could easily push the price below the key support level at 1.3100 and towards the 50-day Exponential Moving Average (EMA) at 1.3076.
GBP/USD daily chart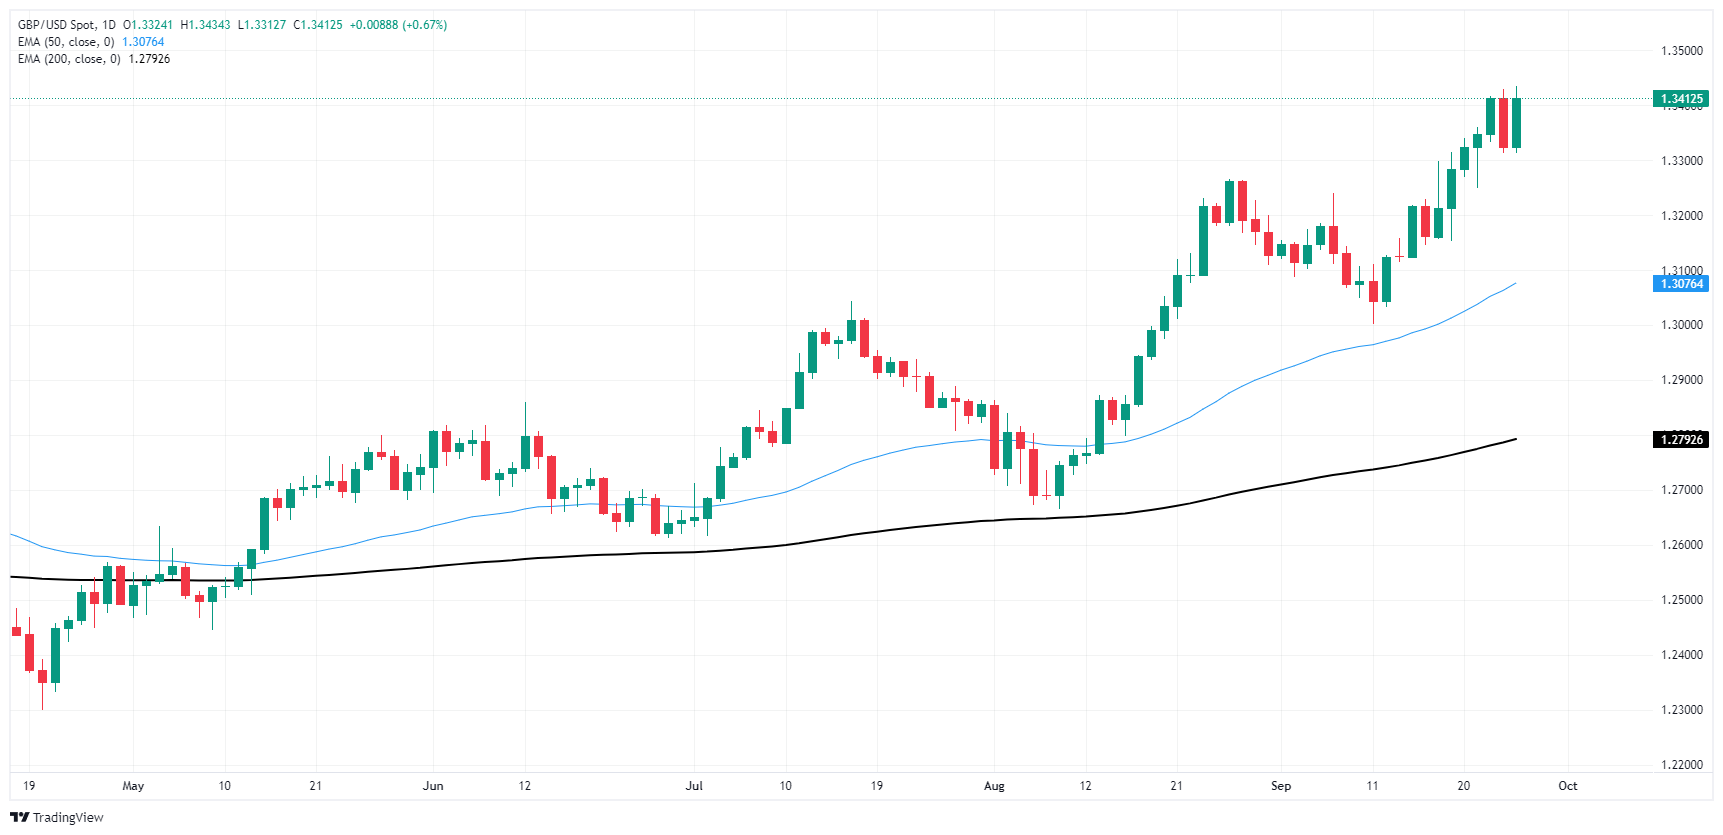
Pound Sterling FAQs
The Pound Sterling (GBP) is the oldest currency in the world (886 AD) and the official currency of the United Kingdom. It is the fourth most traded unit for foreign exchange (FX) in the world, accounting for 12% of all transactions, averaging $630 billion a day, according to 2022 data. Its key trading pairs are GBP/USD, aka ‘Cable’, which accounts for 11% of FX, GBP/JPY, or the ‘Dragon’ as it is known by traders (3%), and EUR/GBP (2%). The Pound Sterling is issued by the Bank of England (BoE).
The single most important factor influencing the value of the Pound Sterling is monetary policy decided by the Bank of England. The BoE bases its decisions on whether it has achieved its primary goal of “price stability” – a steady inflation rate of around 2%. Its primary tool for achieving this is the adjustment of interest rates. When inflation is too high, the BoE will try to rein it in by raising interest rates, making it more expensive for people and businesses to access credit. This is generally positive for GBP, as higher interest rates make the UK a more attractive place for global investors to park their money. When inflation falls too low it is a sign economic growth is slowing. In this scenario, the BoE will consider lowering interest rates to cheapen credit so businesses will borrow more to invest in growth-generating projects.
Data releases gauge the health of the economy and can impact the value of the Pound Sterling. Indicators such as GDP, Manufacturing and Services PMIs, and employment can all influence the direction of the GBP. A strong economy is good for Sterling. Not only does it attract more foreign investment but it may encourage the BoE to put up interest rates, which will directly strengthen GBP. Otherwise, if economic data is weak, the Pound Sterling is likely to fall.
Another significant data release for the Pound Sterling is the Trade Balance. This indicator measures the difference between what a country earns from its exports and what it spends on imports over a given period. If a country produces highly sought-after exports, its currency will benefit purely from the extra demand created from foreign buyers seeking to purchase these goods. Therefore, a positive net Trade Balance strengthens a currency and vice versa for a negative balance.
Recommended Articles


