GBP/JPY Price Forecast: Tests major resistance level but short-term trend bullish

Source Fxstreet
  • GBP/JPY has tested a key resistance level and pulled back. 
  • Notwithstanding the roadblock, the short-term trend remains bullish and could lead to more gains.

GBP/JPY is seen rising for the eighth consecutive day on Wednesday. It has tested and then pulled back from the key September 2 high at 193.49, a major resistance level. The short-term trend is bullish despite the roadblock and could continue, pending a decisive break. 

The 50% Fibonacci retracement level of the July decline at 194.03, could provide further resistance to bulls.

GBP/JPY Daily Chart 

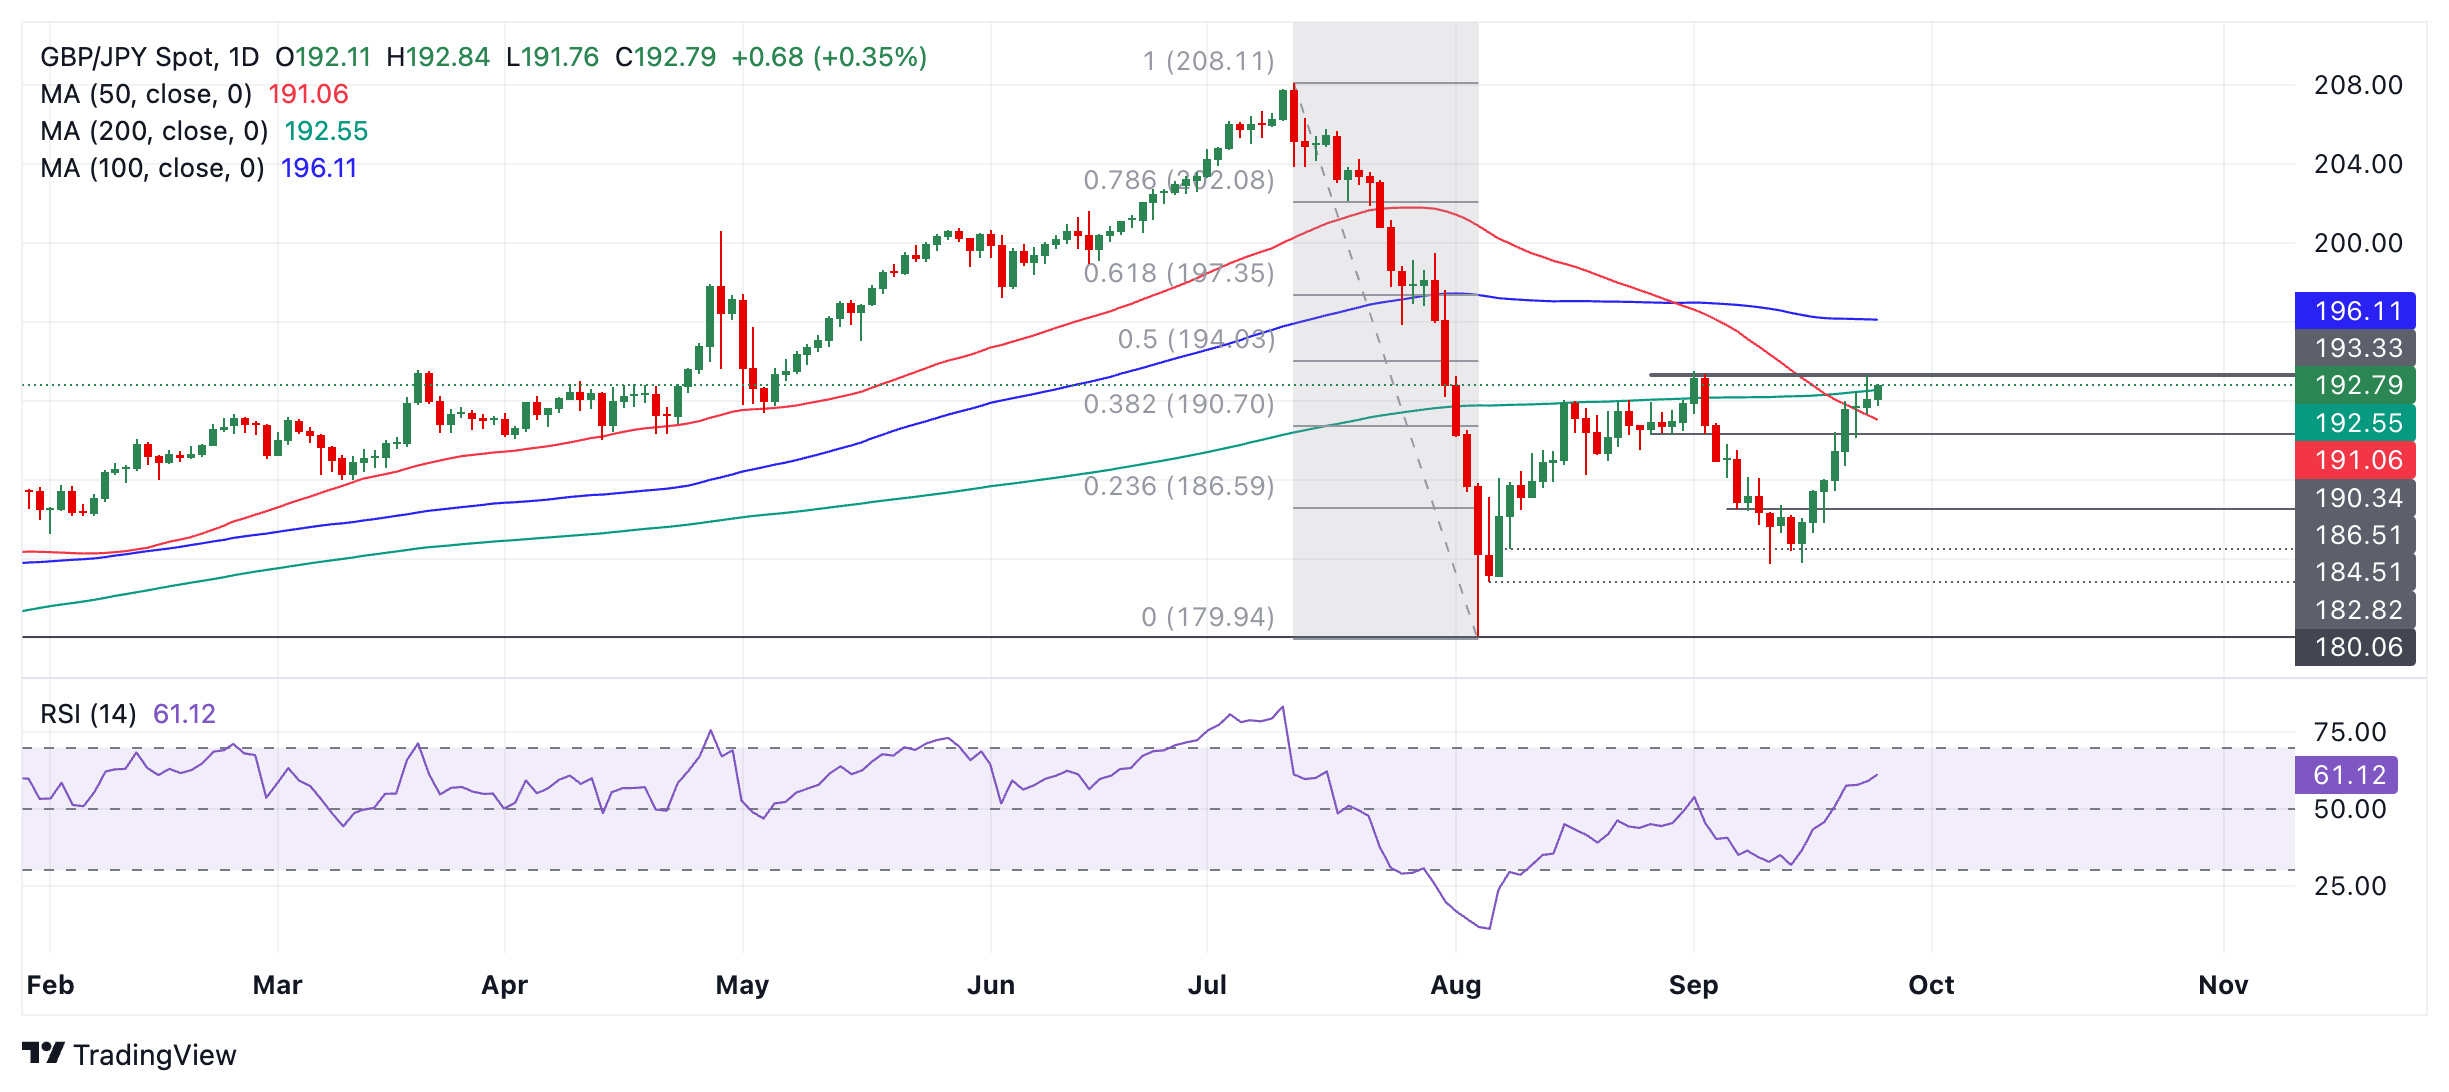
GBP/JPY is in an established short-term uptrend after rising up off the September 11 low. Since it is a principle of technical analysis that “the trend is your friend” this uptrend is more likely than not to extend. 

The pair could simply continue higher, therefore, although it would need to decisively break above the resistance line at 193.49 to confirm such an extension. 

A decisive break would be one accompanied by a longer-than-average green candle that closed near its high, or three green candles in a row that broke above the level. 

The medium-term trend is sideways, however, signifying no bias in either direction, whilst the long-term trend is up.


Disclaimer: For information purposes only. Past performance is not indicative of future results.
placeholder
Natural Gas sinks to pivotal level as China’s demand slumpsNatural Gas price (XNG/USD) edges lower and sinks to $2.56 on Monday, extending its losing streak for the fifth day in a row. The move comes on the back of China cutting its Liquified Natural Gas (LNG) imports after prices rose above $3.0 in June. It
Author  FXStreet
Jul 01, 2024
Natural Gas price (XNG/USD) edges lower and sinks to $2.56 on Monday, extending its losing streak for the fifth day in a row. The move comes on the back of China cutting its Liquified Natural Gas (LNG) imports after prices rose above $3.0 in June. It
placeholder
Gold price declines amid risk-on sentiment despite Fed rate cut expectationsGold price (XAU/USD) continues with its struggle to find acceptance above the $3,400 mark and attracts heavy selling during the Asian session on Monday.
Author  FXStreet
Aug 11, 2025
Gold price (XAU/USD) continues with its struggle to find acceptance above the $3,400 mark and attracts heavy selling during the Asian session on Monday.
placeholder
ECB Policy Outlook for 2026: What It Could Mean for the Euro’s Next MoveWith the ECB likely holding rates steady at 2.15% and the Fed potentially extending cuts into 2026, EUR/USD may test 1.20 if Eurozone growth proves resilient, but weaker growth and an ECB pivot could pull the pair back toward 1.13 and potentially 1.10.
Author  Mitrade
Dec 26, 2025
With the ECB likely holding rates steady at 2.15% and the Fed potentially extending cuts into 2026, EUR/USD may test 1.20 if Eurozone growth proves resilient, but weaker growth and an ECB pivot could pull the pair back toward 1.13 and potentially 1.10.
placeholder
My Top 5 Stock Market Predictions for 2026Five 2026 market predictions written in a native, news-style voice: AI’s winners and losers, broader sector leadership, dividend demand, valuation cooling as the Shiller CAPE sits at 39 (Dec. 31, 2025), and quantum-computing bursts—while keeping all original facts and numbers unchanged.
Author  Mitrade
Jan 06, Tue
Five 2026 market predictions written in a native, news-style voice: AI’s winners and losers, broader sector leadership, dividend demand, valuation cooling as the Shiller CAPE sits at 39 (Dec. 31, 2025), and quantum-computing bursts—while keeping all original facts and numbers unchanged.
placeholder
Gold plummets below $4,200 as US‑Iran tensions spur hawkish rate bets ahead of US CPIGold (XAU/USD) extends the recent breakdown momentum below a technically significant 200-day Simple Moving Average (SMA) and drops to a fresh low since March 23, further below the $4,200 mark during the Asian session on Wednesday.
Author  FXStreet
Jun 10, Wed
Gold (XAU/USD) extends the recent breakdown momentum below a technically significant 200-day Simple Moving Average (SMA) and drops to a fresh low since March 23, further below the $4,200 mark during the Asian session on Wednesday.
Related Instrument
goTop
quote