EUR/JPY Price Forecast: Edges higher to mid-160.00s, remains confined in weekly range

Source Fxstreet
  • EUR/JPY attracts buyers for the second straight day, albeit remains below the weekly top.
  • The technical setup supports prospects for a breakout through the weekly trading range.
  • A convincing break below the 159.00 mark is needed to negate the near-term positive bias.

The EUR/JPY cross trades with a positive bias for the second successive day on Wednesday, albeit lacks bullish conviction and remains confined in a familiar range held since the beginning of this week. Spot prices currently trade around mid-160.00s, up nearly 0.25% for the day and draw support from a combination of factors.

The shared currency benefits from the prevalent US Dollar (USD) selling bias, fueled by rising bets for more aggressive policy easing by the Federal Reserve (Fed). Apart from this, the prevalent risk-on environment undermines the safe-haven Japanese Yen (JPY) and acts as a tailwind for the EUR/JPY cross. That said, the divergent Bank of Japan (BoJ)-European Central Bank (ECB) policy expectations keep a lid on any meaningful appreciating move for the currency pair. 

From a technical perspective, the range-bound price action might be categorized as a bullish consolidation phase against the backdrop of the recent move-up witnessed over the past two weeks or so. Moreover, oscillators on the daily chart have just started gaining positive traction and support prospects for an eventual breakout to the upside. Bulls, however, need to wait for sustained strength and acceptance above the 161.00 mark before placing fresh bets. The EUR/JPY cross might then accelerate the move up to the 161.40-161.45 intermediate resistance en route to the 162.00 round figure. 

The next relevant hurdle is pegged near the 162.45-162.50 region, above which bulls could aim to challenge the monthly peak, around the 162.90 area. Some follow-through buying beyond the 163.00 round figure will negate the negative outlook and shift the near-term bias in favor of bullish traders. 

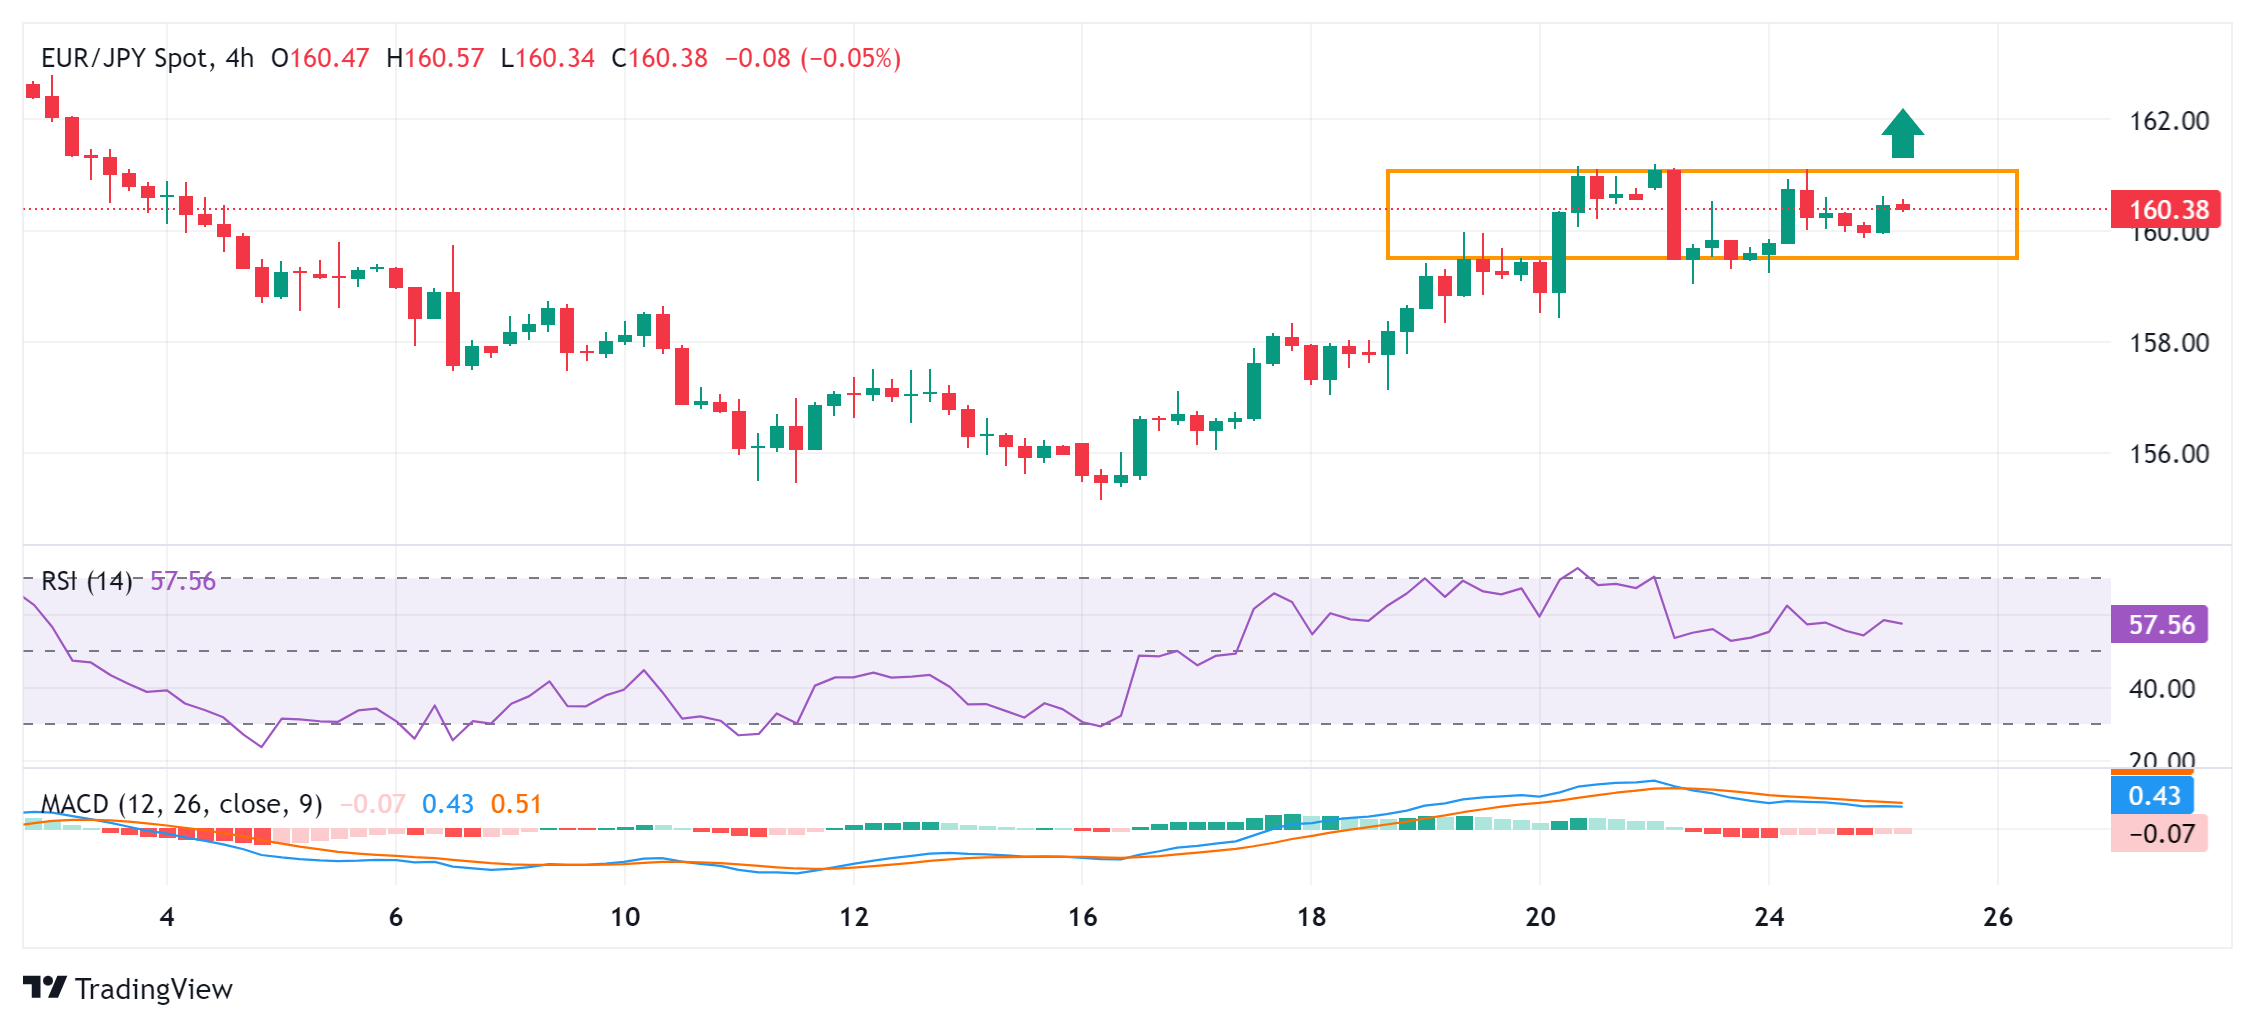
On the flip side, weakness back below the 160.00 psychological mark could find support near the 159.60-159.55 region ahead of the 159.00 round figure, or the lower boundary of the weekly range. A convincing break below the latter will suggest that the recent upward trajectory has run out of steam and drag the EUR/JPY cross further towards the 158.20 area. This is closely followed by the 158.00 round figure, below which spot prices could drop to mid-157.00s en route to the 157.00 mark.

EUR/JPY 4-hour chart

fxsoriginal

Disclaimer: For information purposes only. Past performance is not indicative of future results.
placeholder
Bitcoin Volatility Spikes: Is Options-Driven Pricing Making a Comeback?Bitcoin's volatility is surging, suggesting a shift back to options-driven price action seen before Bitcoin ETFs were launched.
Author  Mitrade
Nov 24, Mon
Bitcoin's volatility is surging, suggesting a shift back to options-driven price action seen before Bitcoin ETFs were launched.
placeholder
2025 Black Friday is coming! Which stocks may see volatility?Coming on the day right after Thanksgiving in the United States, Back Friday marks the start of the holiday shopping season. Sales data from this shopping frenzy day reflects investor confidence and consumer trends. The National Retail Federation (NRF) predicts that holiday season (Nov and Dec) retail sales in 2025 will likely exceed $1 trillion for the very first time, which represents a year-over-year increase of 3.7 to 4.2 percent. Historic data from the past decade show that the retail sector has generally outperformed the S&P 500 during the weeks before and after Black Friday. The following retailing companies are expected to be big winners:
Author  Insights
Nov 24, Mon
Coming on the day right after Thanksgiving in the United States, Back Friday marks the start of the holiday shopping season. Sales data from this shopping frenzy day reflects investor confidence and consumer trends. The National Retail Federation (NRF) predicts that holiday season (Nov and Dec) retail sales in 2025 will likely exceed $1 trillion for the very first time, which represents a year-over-year increase of 3.7 to 4.2 percent. Historic data from the past decade show that the retail sector has generally outperformed the S&P 500 during the weeks before and after Black Friday. The following retailing companies are expected to be big winners:
placeholder
Gold Price Forecast: XAU/USD rises to near $4,150 as Fed rate cut bets growGold price (XAU/USD) attracts some buyers to around $4,140 during the early Asian session on Tuesday. The precious metal rises on growing expectations of a US Federal Reserve (Fed) interest rate cut in the December policy meeting.
Author  FXStreet
Yesterday 01: 29
Gold price (XAU/USD) attracts some buyers to around $4,140 during the early Asian session on Tuesday. The precious metal rises on growing expectations of a US Federal Reserve (Fed) interest rate cut in the December policy meeting.
placeholder
Bitcoin Bleeds to $86K, But This Key Indicator Screams "The Top Isn't In"Bitcoin’s adjusted Spent Output Profit Ratio (aSOPR) has spent nearly two years coiling below the extremes seen at past bull-market peaks, even as BTC trades around $86,300 and down 9% on the week — a setup that leaves open the possibility that this cycle’s true top may still lie ahead.
Author  Mitrade
Yesterday 07: 27
Bitcoin’s adjusted Spent Output Profit Ratio (aSOPR) has spent nearly two years coiling below the extremes seen at past bull-market peaks, even as BTC trades around $86,300 and down 9% on the week — a setup that leaves open the possibility that this cycle’s true top may still lie ahead.
placeholder
Bitcoin Price Rebound Gains Traction with $90K Break in SightBitcoin is trading above $87,000 and its 100-hour SMA after rebounding from $83,500, with a bearish trend line at $88,200 and resistance at $89,000–$90,000 now in focus as BTC either breaks higher toward $91,750–$94,000 or slips back toward $86,700, $85,000 and lower supports.
Author  Mitrade
11 hours ago
Bitcoin is trading above $87,000 and its 100-hour SMA after rebounding from $83,500, with a bearish trend line at $88,200 and resistance at $89,000–$90,000 now in focus as BTC either breaks higher toward $91,750–$94,000 or slips back toward $86,700, $85,000 and lower supports.
goTop
quote