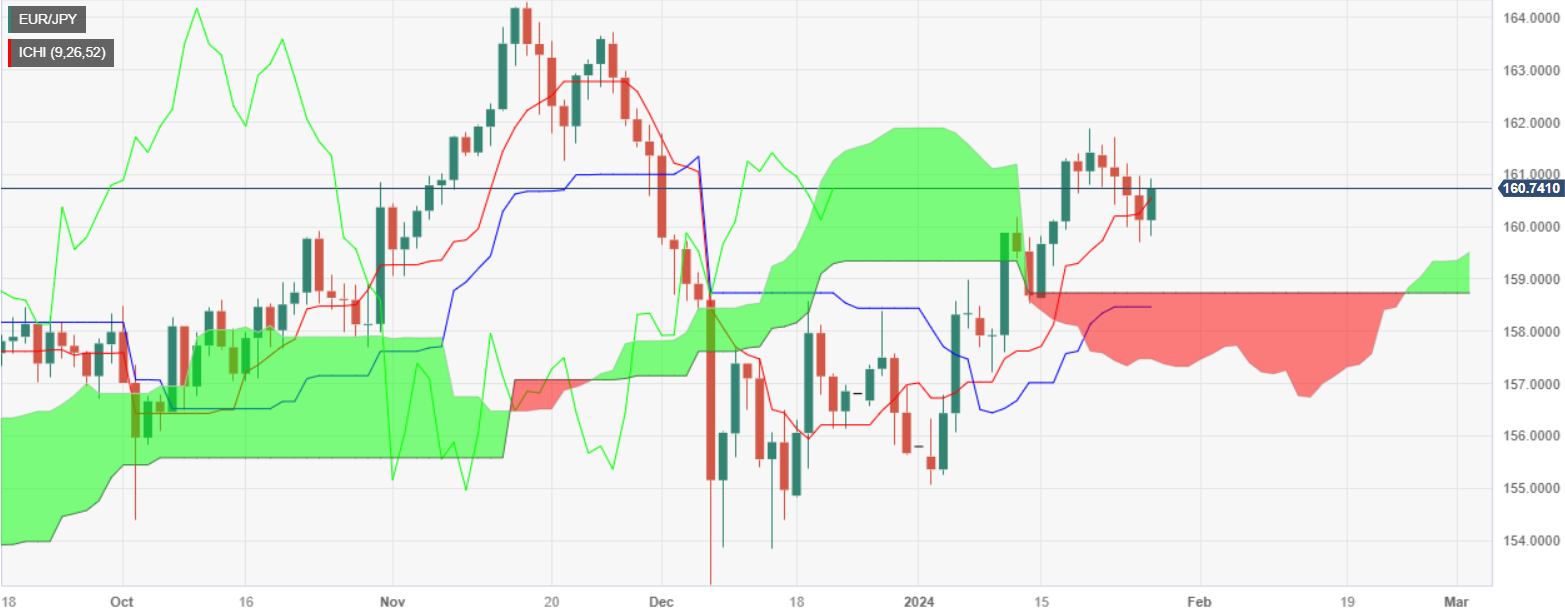
EUR/JPY Price Analysis: Bullish-harami at daily to pave the way to 162.00

Source Fxstreet
  • EUR/JPY up 0.39%, rebounding from daily low as Yen weakens in FX market.
  • Bullish harami pattern suggests upside potential; resistance at 161.00, then January 19 high.
  • Downside risks if below Tenkan/Sen (160.55); next supports at 160.00, 159.69, 159.51.

The EUR/JPY bounces off weekly lows late on Friday’s North American session and is up 0.39% as the Japanese Yen (JPY) remains the laggard across the FX space. At the time of writing, the cross-pair exchanges hands at 160.77 after reaching a daily low of 159.83.

From a technical standpoint, price action in the last couple of days is forming a ‘bullish harami’ two-candle pattern that reassembles an inside day, which leads to price action to the upside. If buyers lift the 161.00, the next resistance would be the January 19 high at 161.87, with the psychological 162.00 up next.

On the flip side, if sellers drop below the Tenkan/Sen at 160.55, the next support would be 160.00, followed by the January 25 daily low of 159.69 and the Senkou Span A at 159.51.

EUR/JPY Price Action – Daily Chart

EUR/JPY Technical Levels


Disclaimer: For information purposes only. Past performance is not indicative of future results.
placeholder
New Fed Chair to Cut Forward Guidance? Warsh Rejects Dot-Plot Expectations, Bullish or Bearish for Bitcoin? If Warsh rejects dot plot projections, it could suppress institutional capital and weaken market risk appetite in the short term, but is a long-term positive for Bitcoin.On June 17, Asian
Author  TradingKey
7 hours ago
If Warsh rejects dot plot projections, it could suppress institutional capital and weaken market risk appetite in the short term, but is a long-term positive for Bitcoin.On June 17, Asian
placeholder
Three Major International Investment Banks Bearish on Oil Outlook, Citi Expects Brent to Fall to $70. Crude Oil Prices Fall for Four Straight Days to Levels at Start of US-Iraq War.On June 16, after US President Donald Trump sent consecutive signals of geopolitical easing, the two major crude oil benchmarks extended their recent declines and are poised to return to
Author  TradingKey
15 hours ago
On June 16, after US President Donald Trump sent consecutive signals of geopolitical easing, the two major crude oil benchmarks extended their recent declines and are poised to return to
placeholder
Japanese Yen hangs near intervention zone despite BoJ rate hike, ahead of FOMCThe USD/JPY pair ticks lower during the Asian session on Wednesday, though it remains within striking distance of the highest level since late April, touched last week.
Author  FXStreet
15 hours ago
The USD/JPY pair ticks lower during the Asian session on Wednesday, though it remains within striking distance of the highest level since late April, touched last week.
placeholder
Has Gold Hit Bottom? Barclays, Citi Both Bullish on Gold, Gold Price Will Return to $5,000 Next Year.Since 2026, gold has erased almost all of its gains and has fallen more than 20% from its record high of $5,595 set at the end of January. Has gold bottomed out? Is now the time to add to
Author  TradingKey
Yesterday 10: 30
Since 2026, gold has erased almost all of its gains and has fallen more than 20% from its record high of $5,595 set at the end of January. Has gold bottomed out? Is now the time to add to
placeholder
WTI hovers around $80.00 as traders await developments on US-Iran peace talksWest Texas Intermediate (WTI) oil price inches higher after registering 3.7% losses in the previous day, trading around $80.10 per barrel during the Asian hours on Tuesday.
Author  FXStreet
Yesterday 01: 19
West Texas Intermediate (WTI) oil price inches higher after registering 3.7% losses in the previous day, trading around $80.10 per barrel during the Asian hours on Tuesday.
Related Instrument
goTop
quote