

GBP/USD holds steady amid soft US inflation, ahead of Fed and BoE’s decision

Source Fxstreet
  • GBP/USD stable in mid-North American session post US data, with soft inflation boosting rate cut expectations.
  • US PCE Index shows steady headline inflation at 2.6%; core rate drops to 2.9%, hinting at possible May Fed rate cut.
  • Focus shifts to upcoming central bank decisions; Fed likely to hold rates, BoE expected to maintain Bank Rate.

The GBP/USD was virtually unchanged in the mid-North American session on Friday after data from the United States (US) was released. A softer inflation reading was cheered by investors, who remained confident the Federal Reserve (Fed) would cut rates in May. Despite that, the major remains flat, hovering around 1.2700, set to finish the week with minuscule gains.

GBP/USD hovers around its opening price following soft US PCE data; traders eye central bank decisions

The US Personal Consumption Expenditures (PCE) Price Index was revealed by the US Department of Commerce suggesting that inflation continues its downtrend. Headline inflation rose by 2.6%, unchanged compared to November’s and expected figures, while the underlying measures dropped from 3.2% to 2.9%. Although the data could allow a rate cut by the Fed, investors estimate the first one would be in May, according to the Chicago Board of Trade (CBOT). Money market traders expect Fed Chair Jerome Powell and Co. to lower rates to 4% by the year’s end.

Given the fundamental backdrop, GBP/USD traders eye the next week’s monetary policy decisions by both central banks. The Fed is expected to keep rates unchanged on January 31, though market participants will be eyeing Powell’s press conference.

Across the pond, the Bank of England (BoE) is foreseen to keep the Bank Rate at 5.25%, although with a unanimous vote, than the previous 6-3 split by February 1. Investors are eyeing the release of economic projections and the BoE’s press conference.

GBP/USD Price Analysis: Technical outlook

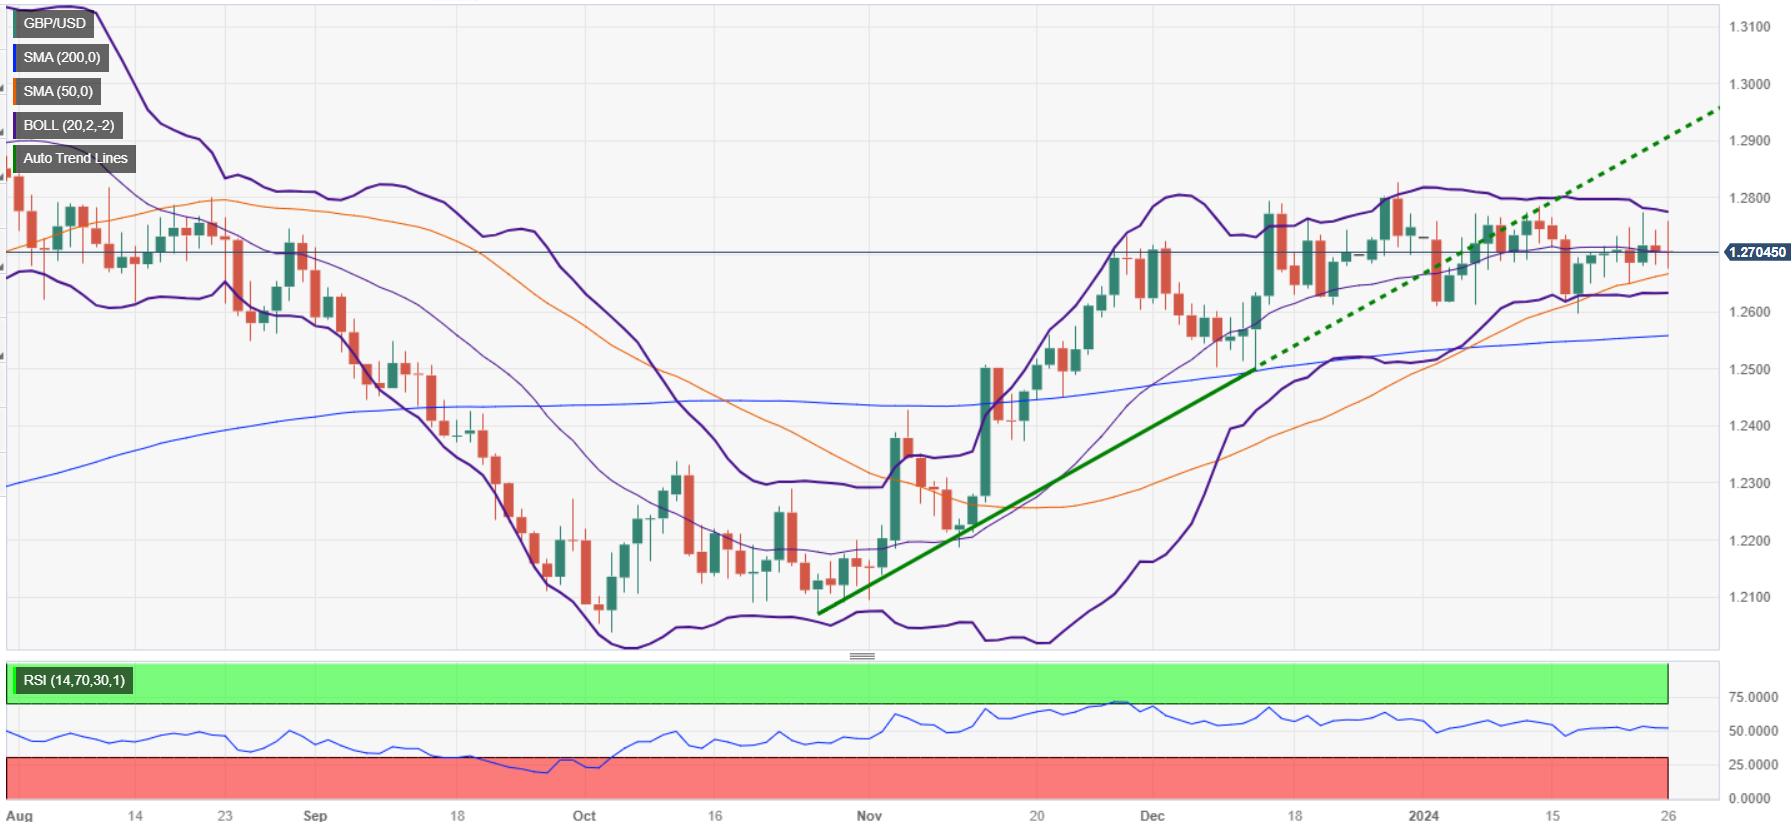
From a technical standpoint, the GBP/USD remains neutrally biased, thought at the brisk of tilting to the downside, as price action closes into the 50-day moving average (DMA), the first support level at 1.2654. if sellers break below the 1.2700 figure and the latter, further downside is seen. The next demand zone would be the January 5 low of 1.2611 and the 1.2600 figure. On the upside, the pairJanuary first resistance would be the January 24 cycle high at 1.2774, before testing 1.2800.
 

Disclaimer: For information purposes only. Past performance is not indicative of future results.
placeholder
WTI (USOIL) Is down 2.03% on Sep 25: Here Is WhyWTI (USOIL) is down 2.03% at Sep 24 22:20(UTC+0), now at $92.517, with a 7-day down of 3.63%.What is driving WTI (USOIL)’s stock price down today?The drop in WTI crude oil prices was primarily driven by
Author  TradingKey
14 hours ago
WTI (USOIL) is down 2.03% at Sep 24 22:20(UTC+0), now at $92.517, with a 7-day down of 3.63%.What is driving WTI (USOIL)’s stock price down today?The drop in WTI crude oil prices was primarily driven by
placeholder
Silver Price Forecast: XAG/USD remains steady near $64.00 as oil prices easeSilver price (XAG/USD) inches higher after two days of losses, trading around $63.90 per troy ounce during Asian hours on Friday. Non-yielding Silver is finding underlying support as inflation concerns ease following a pullback in crude oil prices.
Author  FXStreet
16 hours ago
Silver price (XAG/USD) inches higher after two days of losses, trading around $63.90 per troy ounce during Asian hours on Friday. Non-yielding Silver is finding underlying support as inflation concerns ease following a pullback in crude oil prices.
placeholder
Gold Price Forecast: Gold Drops Below $4,300, Will It Continue to Fall? As of the European session on September 24, gold prices (XAUUSD) extended their correction, dipping below $4,300 intraday to hit a low of $4,262.45. After previously rebounding close to $
Author  TradingKey
Yesterday 09: 57
As of the European session on September 24, gold prices (XAUUSD) extended their correction, dipping below $4,300 intraday to hit a low of $4,262.45. After previously rebounding close to $
placeholder
Yen touches 158.37 as Tokyo reopens, then slips back — ¥15.4 trillion of intervention and the 200-day line stand between here and 160USD/JPY reached 158.37 overnight, its highest since early September, then eased to 157.88 as Japanese markets reopened after a three-day holiday. The Ministry of Finance has spent ¥15.4 trillion defending the yen since late July and the BOJ ran a rate check on September 18. The 200-day average sits at 158.43.
Author  Irene Q.
Yesterday 06: 59
USD/JPY reached 158.37 overnight, its highest since early September, then eased to 157.88 as Japanese markets reopened after a three-day holiday. The Ministry of Finance has spent ¥15.4 trillion defending the yen since late July and the BOJ ran a rate check on September 18. The 200-day average sits at 158.43.
placeholder
US input costs rose at the fastest pace in four years — the September flash PMI beat is an inflation story, not a growth storyUS September flash PMIs came in far above expectations, with the composite at 58.4, a five-year high. But the detail that moved markets was input cost inflation at its fastest since October 2022, driven by fuel, transport and supply shortages. Brent is back above $100 and the 10-year Treasury yield has hit its highest since 2007.
Author  Suzie
Yesterday 06: 46
US September flash PMIs came in far above expectations, with the composite at 58.4, a five-year high. But the detail that moved markets was input cost inflation at its fastest since October 2022, driven by fuel, transport and supply shortages. Brent is back above $100 and the 10-year Treasury yield has hit its highest since 2007.
Related Instrument
goTop
quote