


USD/INR rebounds despite Fed's aggressive rate cut
- Indian Rupee weakens in Thursday’s Asian session.
- The increased liquidity flowing into the Indian market and dovish Fed drag the US Dollar down.
- Traders await the US weekly Initial Jobless Claims, the Philly Fed Manufacturing Index and Existing Home Sales on Thursday.
The Indian Rupee (INR) loses ground amid the recovery of the US Dollar (USD) on Thursday. The downside of the INR might be limited after the US Federal Reserve (Fed) made a large rate cut at its September meeting, which might weaken the US Dollar (USD). Furthermore, the persistent Foreign Institutional Investor (FII) funds into Indian equities could further strengthen the local currency.
Nonetheless, further rebound in crude oil prices could undermine the INR as India is the third-largest oil consumer after the United States (US) and China. Moving on, investors await the US weekly Initial Jobless Claims, the Philly Fed Manufacturing Index and Existing Home Sales, which are due later on Thursday.
Daily Digest Market Movers: Indian Rupee edges lower, but potential downside seems limited
- The Reserve Bank of India (RBI) is unlikely to ease the benchmark policy rate during 2024 given the uncertainty over food inflation, said State Bank of India (SBI) chairman C S Setty.
- Finance Minister Nirmala Sitharaman said on Wednesday that India is standing out globally in terms of economic growth and will continue to do so in the next few years.
- The Federal Open Market Committee (FOMC) decided to lower the federal funds rate by 50 basis points (bps) to a range of 4.75% to 5.00%, the Fed’s first rate cut in more than four years.
- Fed Chair Jerome Powell noted during a press conference that the half-point rate reduction did not represent any new pattern for the central bank but that policymakers want to keep the economy and the labor market in good shape.
- Fed policymakers revised their quarterly economic forecasts, raising the median projection for unemployment by the end of 2024 to 4.4% from the 4% projection in June. Fed officials raised their projection for the long-run federal funds rate to 2.9% from 2.8%.
Technical Analysis: USD/INR’s positive stance remains fragile in the longer term
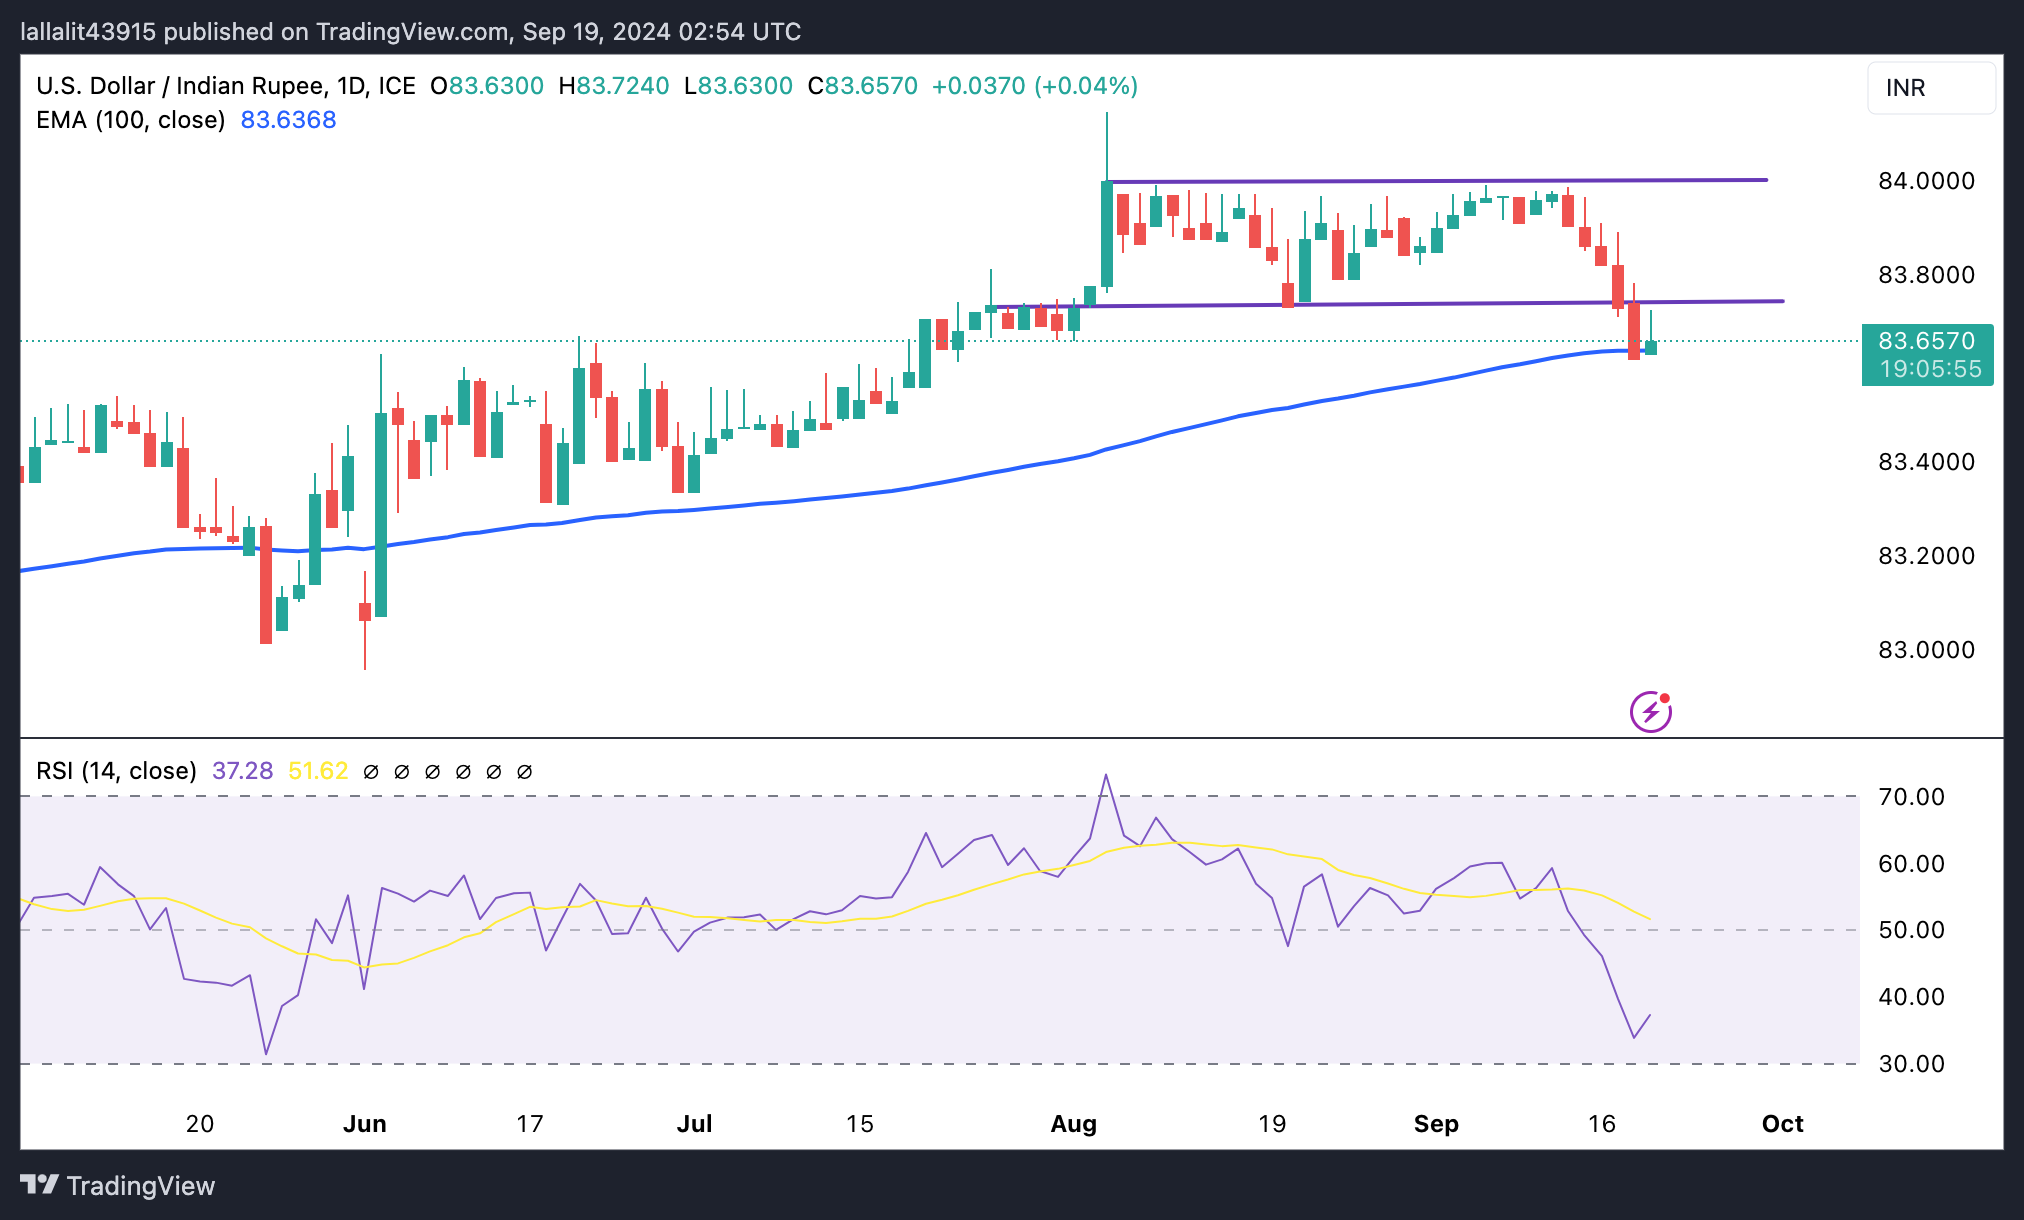
The Indian Rupee trades softer on the day. The USD/INR pair has broken below the rectangle on the daily chart. The bullish outlook of the pair seems vulnerable as the price hovers the key 100-day Exponential Moving Average (EMA). If the pair closes below the 100-day EMA, it could resume the downside. Meanwhile, the 14-day Relative Strength Index (RSI) stands in the bearish zone below the midline near 38.0, suggesting the path of least resistance is to the downside.
The 100-day EMA at 83.64 acts as an initial support level for the pair. A breach of this level could see a drop to 83.31, the low of June 18. Extended losses could attract some sellers to the 83.00 psychological mark.
On the upside, the first upside barrier for USD/INR emerges at the support-turned-resistance level near 83.75. A crucial barrier is seen at the 83.90-84.00 region.
Indian Rupee FAQs
The Indian Rupee (INR) is one of the most sensitive currencies to external factors. The price of Crude Oil (the country is highly dependent on imported Oil), the value of the US Dollar – most trade is conducted in USD – and the level of foreign investment, are all influential. Direct intervention by the Reserve Bank of India (RBI) in FX markets to keep the exchange rate stable, as well as the level of interest rates set by the RBI, are further major influencing factors on the Rupee.
The Reserve Bank of India (RBI) actively intervenes in forex markets to maintain a stable exchange rate, to help facilitate trade. In addition, the RBI tries to maintain the inflation rate at its 4% target by adjusting interest rates. Higher interest rates usually strengthen the Rupee. This is due to the role of the ‘carry trade’ in which investors borrow in countries with lower interest rates so as to place their money in countries’ offering relatively higher interest rates and profit from the difference.
Macroeconomic factors that influence the value of the Rupee include inflation, interest rates, the economic growth rate (GDP), the balance of trade, and inflows from foreign investment. A higher growth rate can lead to more overseas investment, pushing up demand for the Rupee. A less negative balance of trade will eventually lead to a stronger Rupee. Higher interest rates, especially real rates (interest rates less inflation) are also positive for the Rupee. A risk-on environment can lead to greater inflows of Foreign Direct and Indirect Investment (FDI and FII), which also benefit the Rupee.
Higher inflation, particularly, if it is comparatively higher than India’s peers, is generally negative for the currency as it reflects devaluation through oversupply. Inflation also increases the cost of exports, leading to more Rupees being sold to purchase foreign imports, which is Rupee-negative. At the same time, higher inflation usually leads to the Reserve Bank of India (RBI) raising interest rates and this can be positive for the Rupee, due to increased demand from international investors. The opposite effect is true of lower inflation.
Recommended Articles


