EUR/CHF Price Prediction: Bullish engulfing candlestick could indicate more upside

Source Fxstreet
  • EUR/CHF bottomed and formed a Bullish Engulfing candlestick pattern on September 11. 
  • Since then it has recovered then pulled back – it could soon resume upside again. 

EUR/CHF reached a temporary bottom on September 11 and recovered. It is currently trading above 0.9400. There are signs that suggest it could continue higher despite the overall bearish medium-term trend.

EUR/CHF Daily Chart 


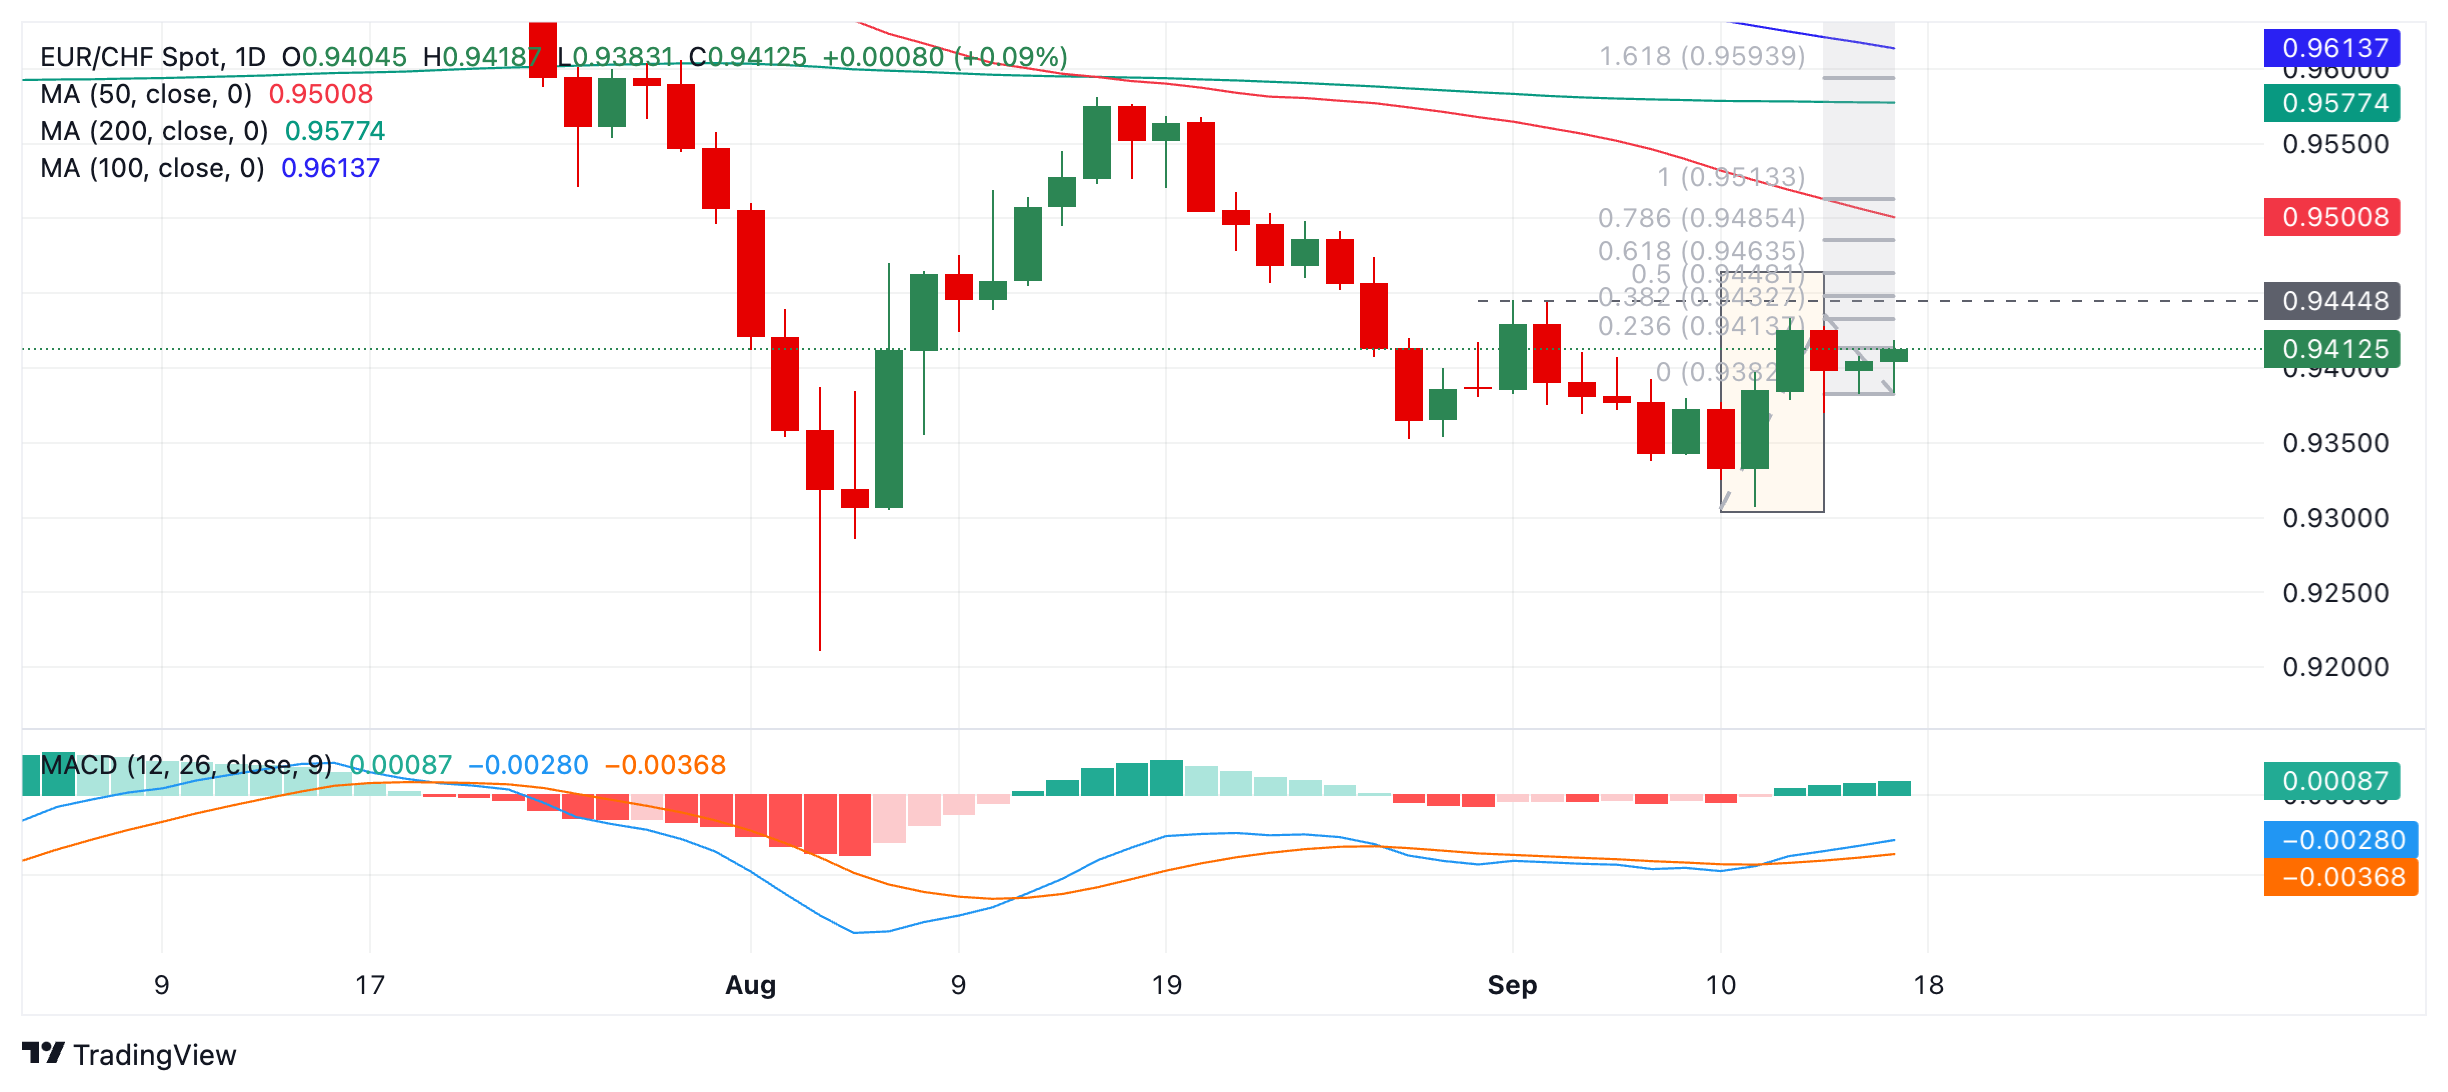
EUR/CHF formed a Bullish Engulfing Japanese candlestick pattern when it touched bottom on September 11. This occurs when price bottoms out, recovers and during the recovery day encloses – or "engulfs" – the whole of the preceding day's body in new day's body. The initial engulfing candle was followed by a confirmatory green follow-up day (shaded rectangle) adding confidence. This pattern is a short-term bullish signal. 

The pair has pulled back slightly since peaking on September 12, however, the correction has been shallow so far and it is possible the pair will resume moving higher. 

A break above the 0.9434 high (September 12) would confirm a continuation higher, with the next target at 0.9464, followed by 0.9513 in the case of a particularly bullish move. 

A break below 0.9369 would invalidate the bullish hypothesis and suggest a more neutral or bearish outlook.


Disclaimer: For information purposes only. Past performance is not indicative of future results.
placeholder
Bitcoin Briefly Falls Below $76,000: Will Powell Staying on Board Curb Rally? Fed maintains interest rates, Bitcoin price falls below $76,000 as Powell's stay may hinder rebound.On April 30 (GMT+8), Bitcoin ( BTC) narrowed its losses and returned above $76,000, cur
Author  TradingKey
7 hours ago
Fed maintains interest rates, Bitcoin price falls below $76,000 as Powell's stay may hinder rebound.On April 30 (GMT+8), Bitcoin ( BTC) narrowed its losses and returned above $76,000, cur
placeholder
Brent Oil Breaks Through $120 Mark, Strait of Hormuz Deadlock Continues to Ferment, How Will Trump’s Choice Sway Oil Price Direction?Hopes for a resolution to the U.S.-Iran deadlock are fading, and the oil price rally continued during the Asian session. On Thursday, dampened by pessimistic news regarding peace talks, B
Author  TradingKey
9 hours ago
Hopes for a resolution to the U.S.-Iran deadlock are fading, and the oil price rally continued during the Asian session. On Thursday, dampened by pessimistic news regarding peace talks, B
placeholder
Today’s Market Recap: Fed Dissent and AI Capex Surges Define Volatile Earnings Week The S&P 500 edged down 0.04% to 7,135.95, while the Nasdaq Composite gained a modest 0.04% to reach 24,673.24. Meanwhile, the Dow Jones Industrial Average declined 0
Author  TradingKey
16 hours ago
The S&P 500 edged down 0.04% to 7,135.95, while the Nasdaq Composite gained a modest 0.04% to reach 24,673.24. Meanwhile, the Dow Jones Industrial Average declined 0
placeholder
Goldman Sachs: Structurally Bullish on Gold to $5,400, But Warns of Short-Term PullbackGoldman Sachs ( GS) 's latest precious metals research report on gold ( XAUUSD) price trends presents a "structurally bullish, tactically cautious" dual outlook, maintaining its year-end
Author  TradingKey
Yesterday 10: 13
Goldman Sachs ( GS) 's latest precious metals research report on gold ( XAUUSD) price trends presents a "structurally bullish, tactically cautious" dual outlook, maintaining its year-end
placeholder
UAE Announces Exit From OPEC. Wall Street Warns: Medium-Term Oil Prices Face Downside RisksThe United Arab Emirates (UAE) has officially announced that it will formally withdraw from the Organization of the Petroleum Exporting Countries (OPEC) and the OPEC+ alliance on May 1.Bl
Author  TradingKey
Yesterday 06: 15
The United Arab Emirates (UAE) has officially announced that it will formally withdraw from the Organization of the Petroleum Exporting Countries (OPEC) and the OPEC+ alliance on May 1.Bl
Related Instrument
goTop
quote