NZD/JPY Price Analysis: Technical outlook favours further decline in the near term as bears push down

Source Fxstreet
  • The NZD/JPY pair has been in a downtrend, declining in four of the last six sessions.
  • The RSI is oversold and has a declining slope, indicating that selling pressure is increasing.
  • The MACD is also negative and the histogram is rising.

Friday's session saw the NZD/JPY pair decline by more than 1% to 86.60 marking another day of losses. The pair has been in a downtrend over the past week, closing lower in four of the last six sessions. The overall technical outlook for the NZD/JPY is negative, and the pair is likely to continue to decline in the near term.

The RSI is currently near 30, approaching the oversold area. The slope of the RSI is also declining, which suggests that selling pressure is increasing. The MACD is also negative and the histogram is rising, indicating that selling pressure is increasing. However, the oversold signals may indicate that the pair may be poised for an upward correction to consolidate the latest downward movements.

NZD/JPY daily chart

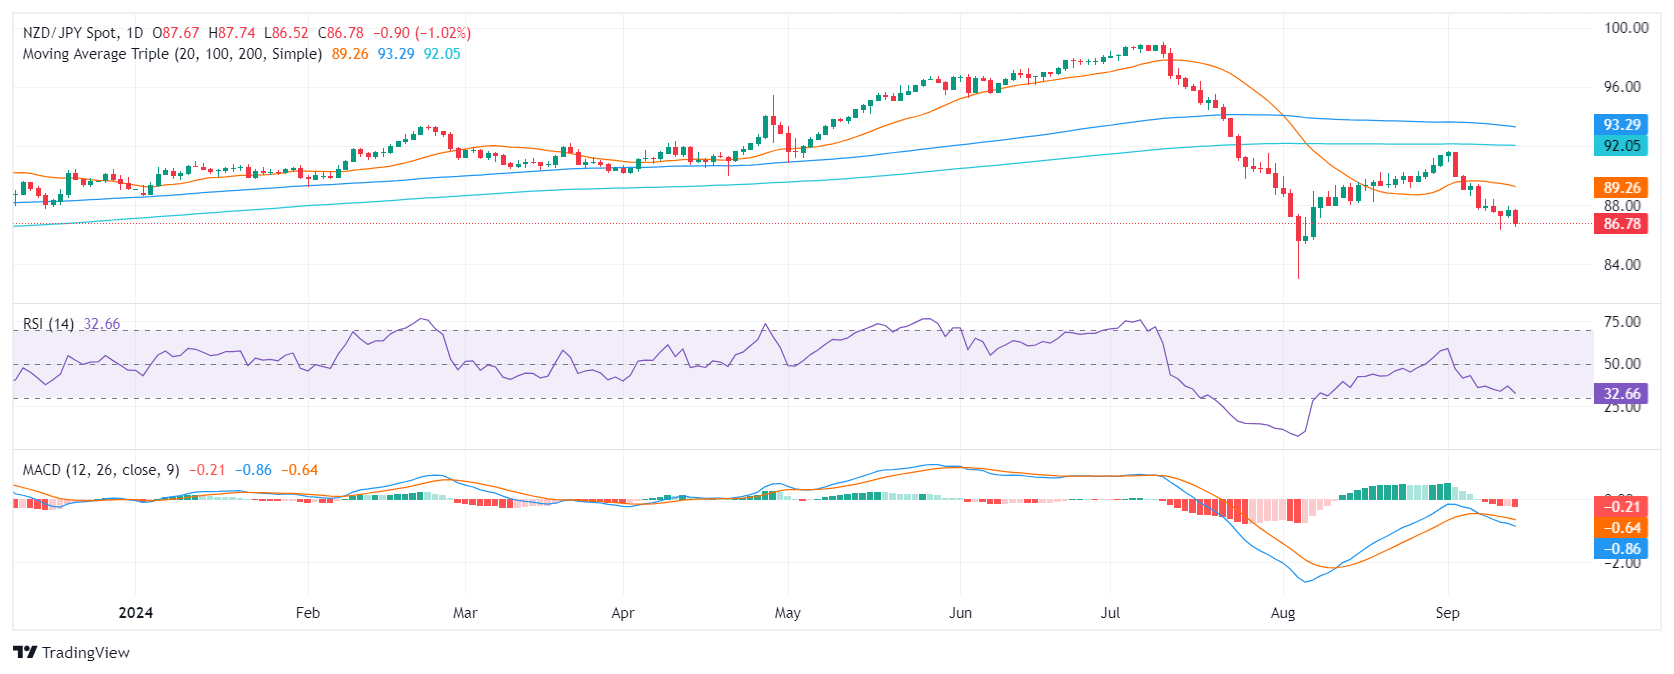
Supports to the downside are located at 86.00, 85.00, and 84.00, while resistances are seen at 88.00, 89.00, and 90.00.


Disclaimer: For information purposes only. Past performance is not indicative of future results.
placeholder
Crypto Weekly Radar: All eyes on Donald Trump’s ultimatum, US macroeconomic dataCrypto markets begin the week with mixed sentiment, with Bitcoin (BTC) trading above $69,000 following last week’s rebound. Still, markets remain cautious as traders weigh risks stemming from Donald Trump’s renewed threats toward Iran ahead of the ultimatum set for Tuesday.
Author  FXStreet
12 hours ago
Crypto markets begin the week with mixed sentiment, with Bitcoin (BTC) trading above $69,000 following last week’s rebound. Still, markets remain cautious as traders weigh risks stemming from Donald Trump’s renewed threats toward Iran ahead of the ultimatum set for Tuesday.
placeholder
WTI eases below $103.50 as US, Iran reportedly seeking 45-day ceasefireWest Texas Intermediate (WTI), the US crude oil benchmark, is trading around $103.30 during the early European trading hours on Monday. The WTI price retreats after reports that the United States (US) and Iran are making a push for a 45-day ceasefire. 
Author  FXStreet
12 hours ago
West Texas Intermediate (WTI), the US crude oil benchmark, is trading around $103.30 during the early European trading hours on Monday. The WTI price retreats after reports that the United States (US) and Iran are making a push for a 45-day ceasefire. 
placeholder
Gold under pressure as fears mount, $4,600 support at risk Spot Gold gapped marginally lower at the weekly opening, with the XAU/USD pair battling to retain the $4,600 mark early in the Asian session.
Author  TradingKey
20 hours ago
Spot Gold gapped marginally lower at the weekly opening, with the XAU/USD pair battling to retain the $4,600 mark early in the Asian session.
placeholder
Gold Second-Quarter Outlook: Safe-Haven Failure or Pricing Logic Reshaping? Can Gold Enter a Major Rally?In the first quarter of 2026, gold prices experienced a classic "roller-coaster" ride. Against a macroeconomic backdrop of escalating geopolitical conflicts, gold prices briefly broke thr
Author  TradingKey
Apr 03, Fri
In the first quarter of 2026, gold prices experienced a classic "roller-coaster" ride. Against a macroeconomic backdrop of escalating geopolitical conflicts, gold prices briefly broke thr
placeholder
Spot Crude Oil Breaks $140. First Time Since 2008. Oil Market’s Most Severe Shock in History Is Here. On Thursday, April 2, Dated Brent crude prices reached $141.37 per barrel, the highest level since 2008, surpassing the peak set during the outbreak of the Russia-Ukraine conflict in 2022
Author  TradingKey
Apr 03, Fri
On Thursday, April 2, Dated Brent crude prices reached $141.37 per barrel, the highest level since 2008, surpassing the peak set during the outbreak of the Russia-Ukraine conflict in 2022
Related Instrument
goTop
quote