USD/JPY Price Forecast: Makes lower lows as trend turns more bearish

Source Fxstreet
  • USD/JPY has fallen to fresh lows at a key support level. 
  • The long-term uptrend has probably reversed as the pair continues to make lower lows. 

USD/JPY continues sliding and makes a lower low at 140.36 on Friday, bottoming out at about the same level as the key December 2023 low – where it is expected to encounter firm support. 

USD/JPY 4-hour Chart 

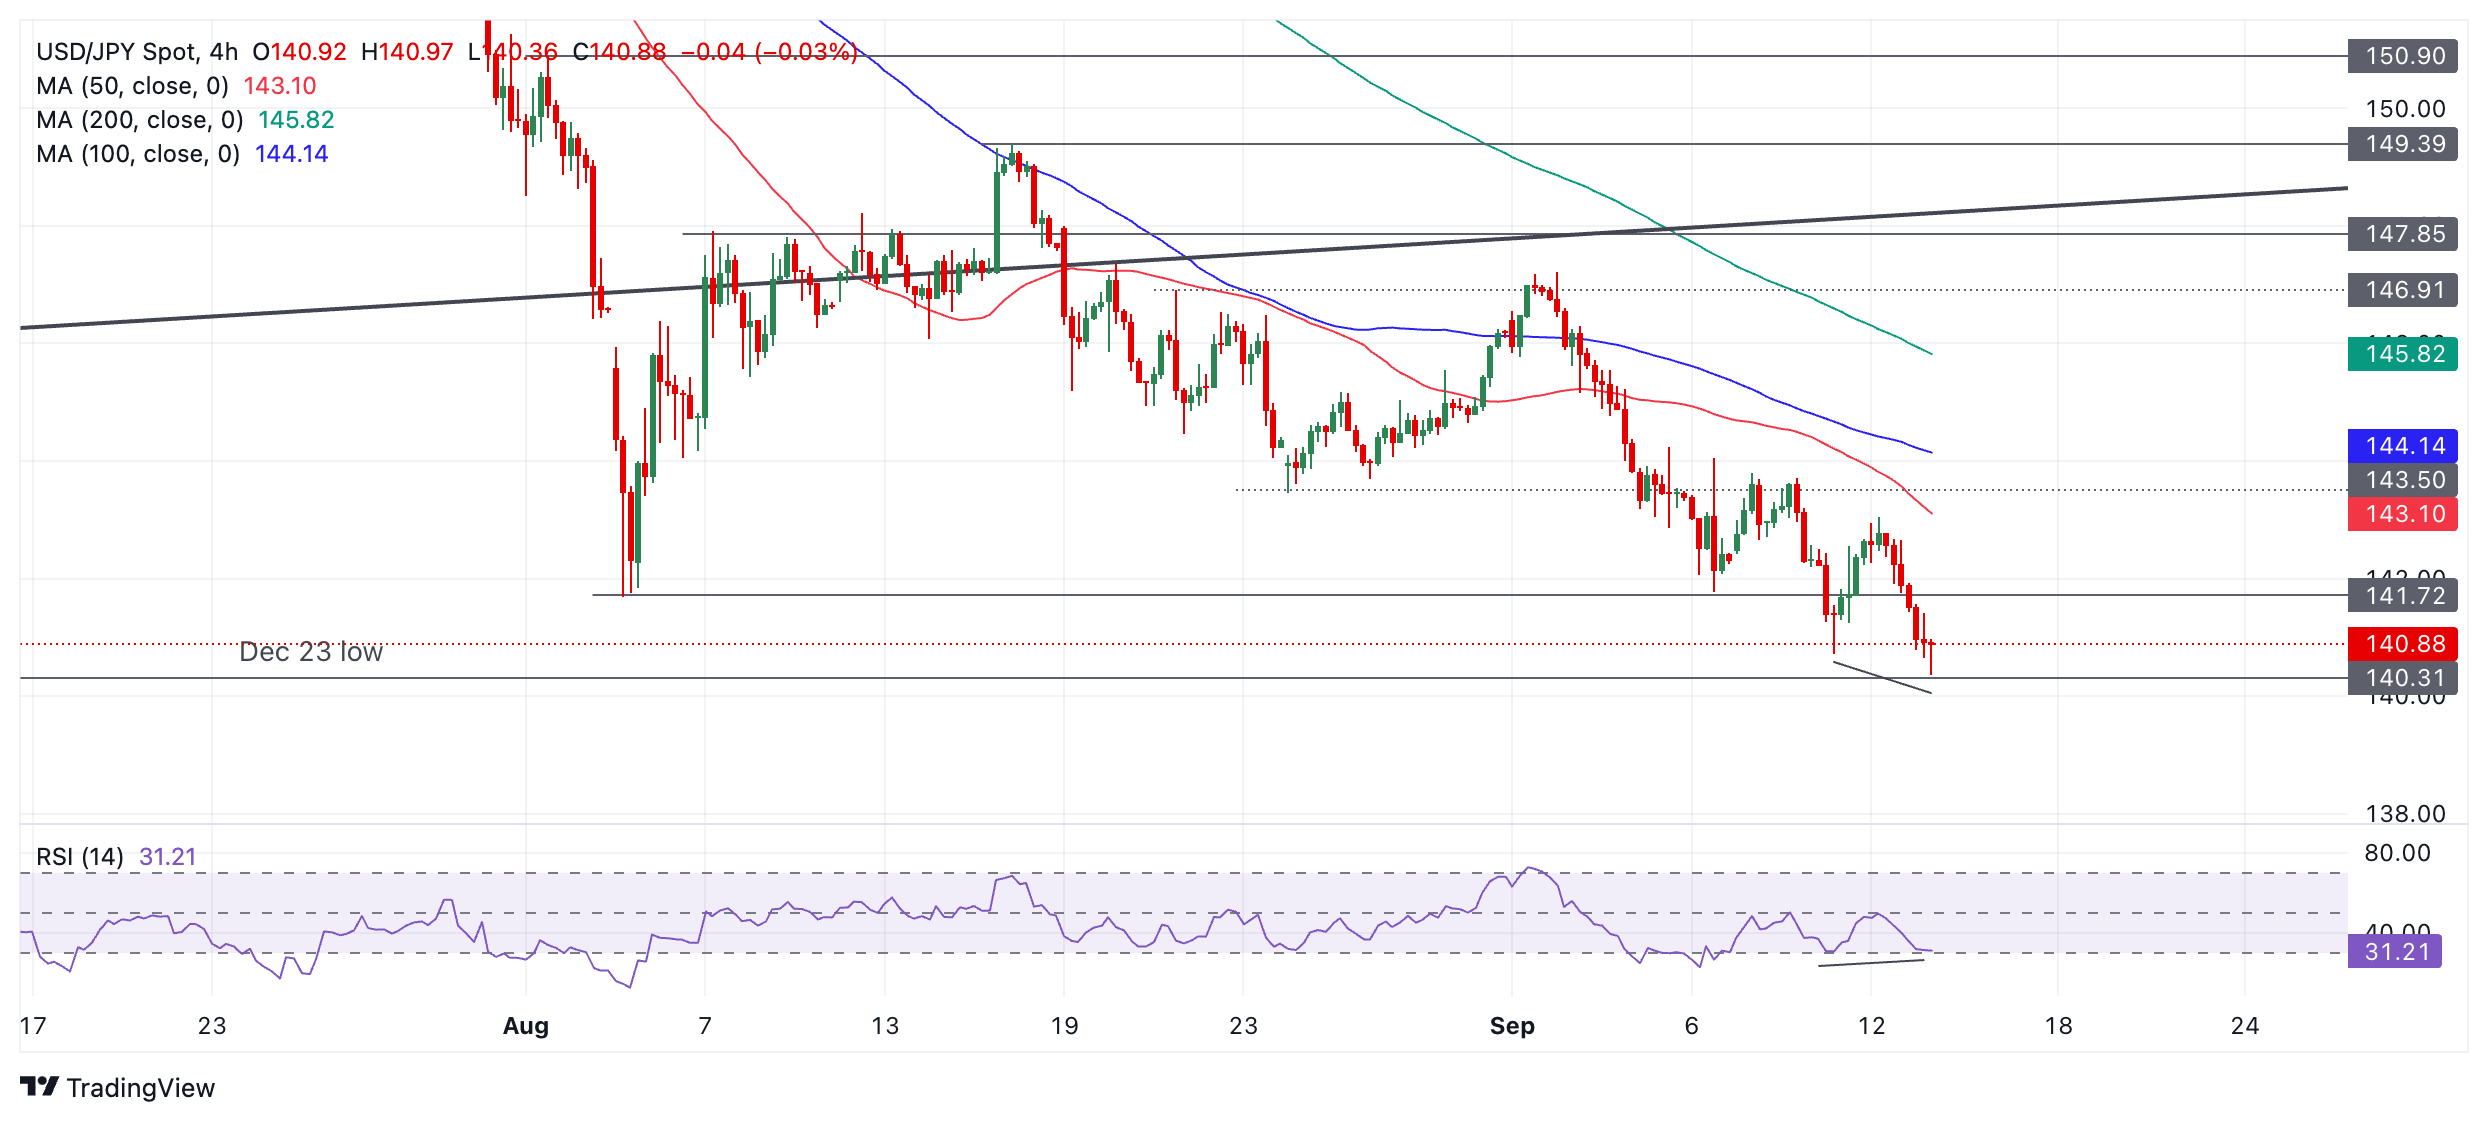
The break below the August 5 low on September 11 crossed an important threshold for the pair. Taken together with the break below the major multi-year trendline at the beginning of August, it suggests a possibility the long-term uptrend has reversed. Given it is a principle of technical analysis that “the trend is your friend” such a reversal suggests the broad bias has shifted from being “bullish” to “bearish”. 

If USD/JPY can make a daily close below the 140.25 December 2023 low, it would provide even more confirmatory evidence of a long-term trend reversal. Such a break might then see price fall to the next target at 137.24 (July 2023 low). It should be noted that the short and medium-term trends are already bearish. 

USD/JPY is showing mild bullish convergence between the price and the Relative Strength Index (RSI). At the September 11 low the RSI was in the oversold zone, now even though price has sunk even lower, the RSI has not. 

This could be a sign that the move down lacks some bearish conviction and suggests a risk of a pull-back evolving. Given the other bearish signs on the chart, however, such a rebound if it materializes is likely to be temporary before the bear trend resumes and takes the pair to new lows. 


Disclaimer: For information purposes only. Past performance is not indicative of future results.
placeholder
Natural Gas sinks to pivotal level as China’s demand slumpsNatural Gas price (XNG/USD) edges lower and sinks to $2.56 on Monday, extending its losing streak for the fifth day in a row. The move comes on the back of China cutting its Liquified Natural Gas (LNG) imports after prices rose above $3.0 in June. It
Author  FXStreet
Jul 01, 2024
Natural Gas price (XNG/USD) edges lower and sinks to $2.56 on Monday, extending its losing streak for the fifth day in a row. The move comes on the back of China cutting its Liquified Natural Gas (LNG) imports after prices rose above $3.0 in June. It
placeholder
The dollar weakened, equities dipped, and gold hit record highsThe dollar weakened, equities fell, and gold set new records on Wednesday as investors waited for a Fed rate cut later in the day.
Author  Cryptopolitan
Sep 17, 2025
The dollar weakened, equities fell, and gold set new records on Wednesday as investors waited for a Fed rate cut later in the day.
placeholder
Markets in 2026: Will gold, Bitcoin, and the U.S. dollar make history again? — These are how leading institutions thinkAfter a turbulent 2025, what lies ahead for commodities, forex, and cryptocurrency markets in 2026?
Author  Insights
Dec 25, 2025
After a turbulent 2025, what lies ahead for commodities, forex, and cryptocurrency markets in 2026?
placeholder
ECB Policy Outlook for 2026: What It Could Mean for the Euro’s Next MoveWith the ECB likely holding rates steady at 2.15% and the Fed potentially extending cuts into 2026, EUR/USD may test 1.20 if Eurozone growth proves resilient, but weaker growth and an ECB pivot could pull the pair back toward 1.13 and potentially 1.10.
Author  Mitrade
Dec 26, 2025
With the ECB likely holding rates steady at 2.15% and the Fed potentially extending cuts into 2026, EUR/USD may test 1.20 if Eurozone growth proves resilient, but weaker growth and an ECB pivot could pull the pair back toward 1.13 and potentially 1.10.
placeholder
Gold tumbles below $4,650 as inflation fears and liquidity squeeze weighGold price (XAU/USD) remains under selling pressure near $4,640 during the early Asian session on Friday. The precious metal extends the decline as soaring crude oil and energy prices, driven by the escalating US-Israeli war with Iran, reignite inflation fears.
Author  FXStreet
Yesterday 01: 22
Gold price (XAU/USD) remains under selling pressure near $4,640 during the early Asian session on Friday. The precious metal extends the decline as soaring crude oil and energy prices, driven by the escalating US-Israeli war with Iran, reignite inflation fears.
Related Instrument
goTop
quote