

EUR/USD backslides on Thursday after ECB rate hold, US GDP data beat
- EUR/USD dropped back into familiar lows after dovish ECB.
- US PCE inflation snapshot due on Friday.
- Euro on pace to be the worst performer of the major currencies this week.
EUR/USD tumbled back into the low side of 1.0850 as the pair resumes cycling within familiar levels on the week, with bearish flows forcing the Euro (EUR) further down against the US Dollar (USD) after the European Central Bank (ECB) held rates steady and US Gross Domestic Product (GDP) figures grew faster than expected in the fourth quarter.
The ECB held rates steady for a third consecutive meeting, but a dovish tilt to ECB President Christine Lagarde’s monetary policy statement ramped up market bets of faster, deeper cuts from the ECB heading into the middle of the year.
ECB Press Conference: Lagarde explains decision to keep rates steady, speaks on policy outlook
Money markets are now betting that a first 50 basis point cut from the ECB will come by June, with rate swaps pricing in 140 bps in total rate cuts from the ECB by the end of 2024 compared to 130 bps before the ECB rate call.
US GDP grew by 3.3% for the year ended in the fourth quarter, beating the median market forecast of 2.0% despite slipping back from the previous period’s 4.9%. US stocks rallied and the US Dollar Index climbed on reaction.
The trading week will wrap up with US Personal Consumption Expenditures (PCE) Price Index figures during the US market session. As the Federal Reserve’s (Fed) preferred method of tracking inflation, markets will be watching the PCE inflation snapshot carefully on Friday. US MoM PCE inflation is forecast to print at 0.2% in December versus the previous month’s 0.1%, and the annualized PCE inflation print is expected to tick down to 3.0% from 3.2%.
EUR/USD Technical Outlook
EUR/USD saw another rejection from the 200-hour Simple Moving Average (SMA) dropping into 1.0880, and intraday price action found a near-term bottom just above 1.0820 before settling Thursday close to the 1.0850 level.
The EUR/USD remains trapped in a congestion zone between the 50-day and 200-day SMAs at 1.0925 and 1.0850 respectively, trapped in a consolidation pattern as near-term price action drifts into the midrange.
EUR/USD Hourly Chart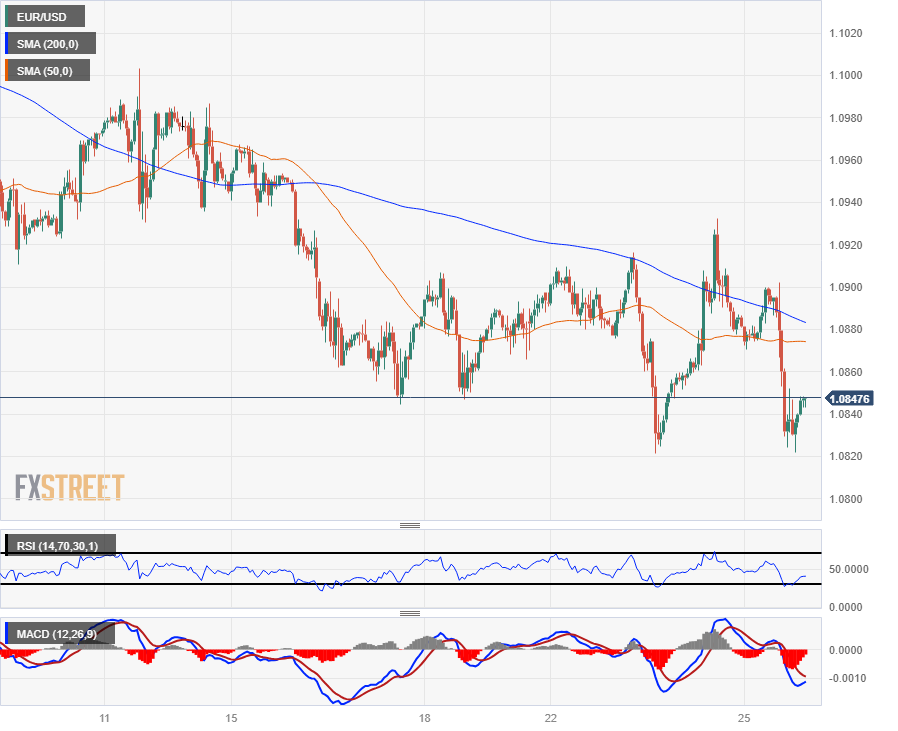
EUR/USD Daily Chart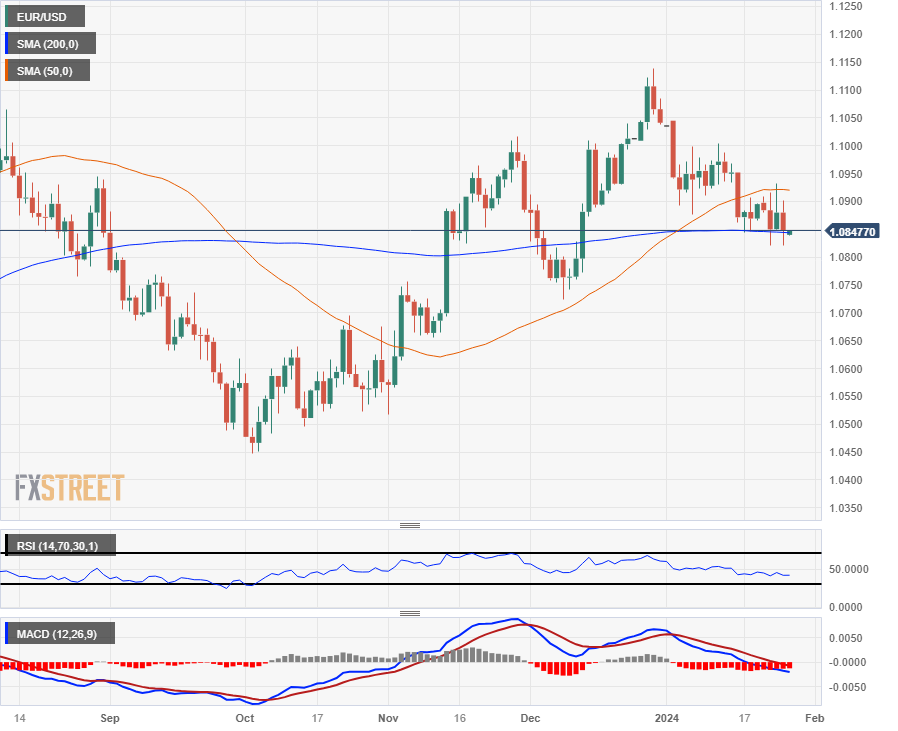
Recommended Articles


