USD/JPY Price Forecast: Testing key lows, long-term uptrend at risk

Source Fxstreet
  • USD/JPY has fallen to a key low – if it breaks and closes below it could threaten the uptrend. 
  • Such a move would probably turn the odds more in favor of bears. 

USD/JPY is testing support at key lows from where it bottomed and pulled back during August. If price breaks back below these lows it could risk signaling a reversal of the long-term uptrend, and suggest a major bearish shift in the technical outlook for the pair. 

USD/JPY Daily Chart 


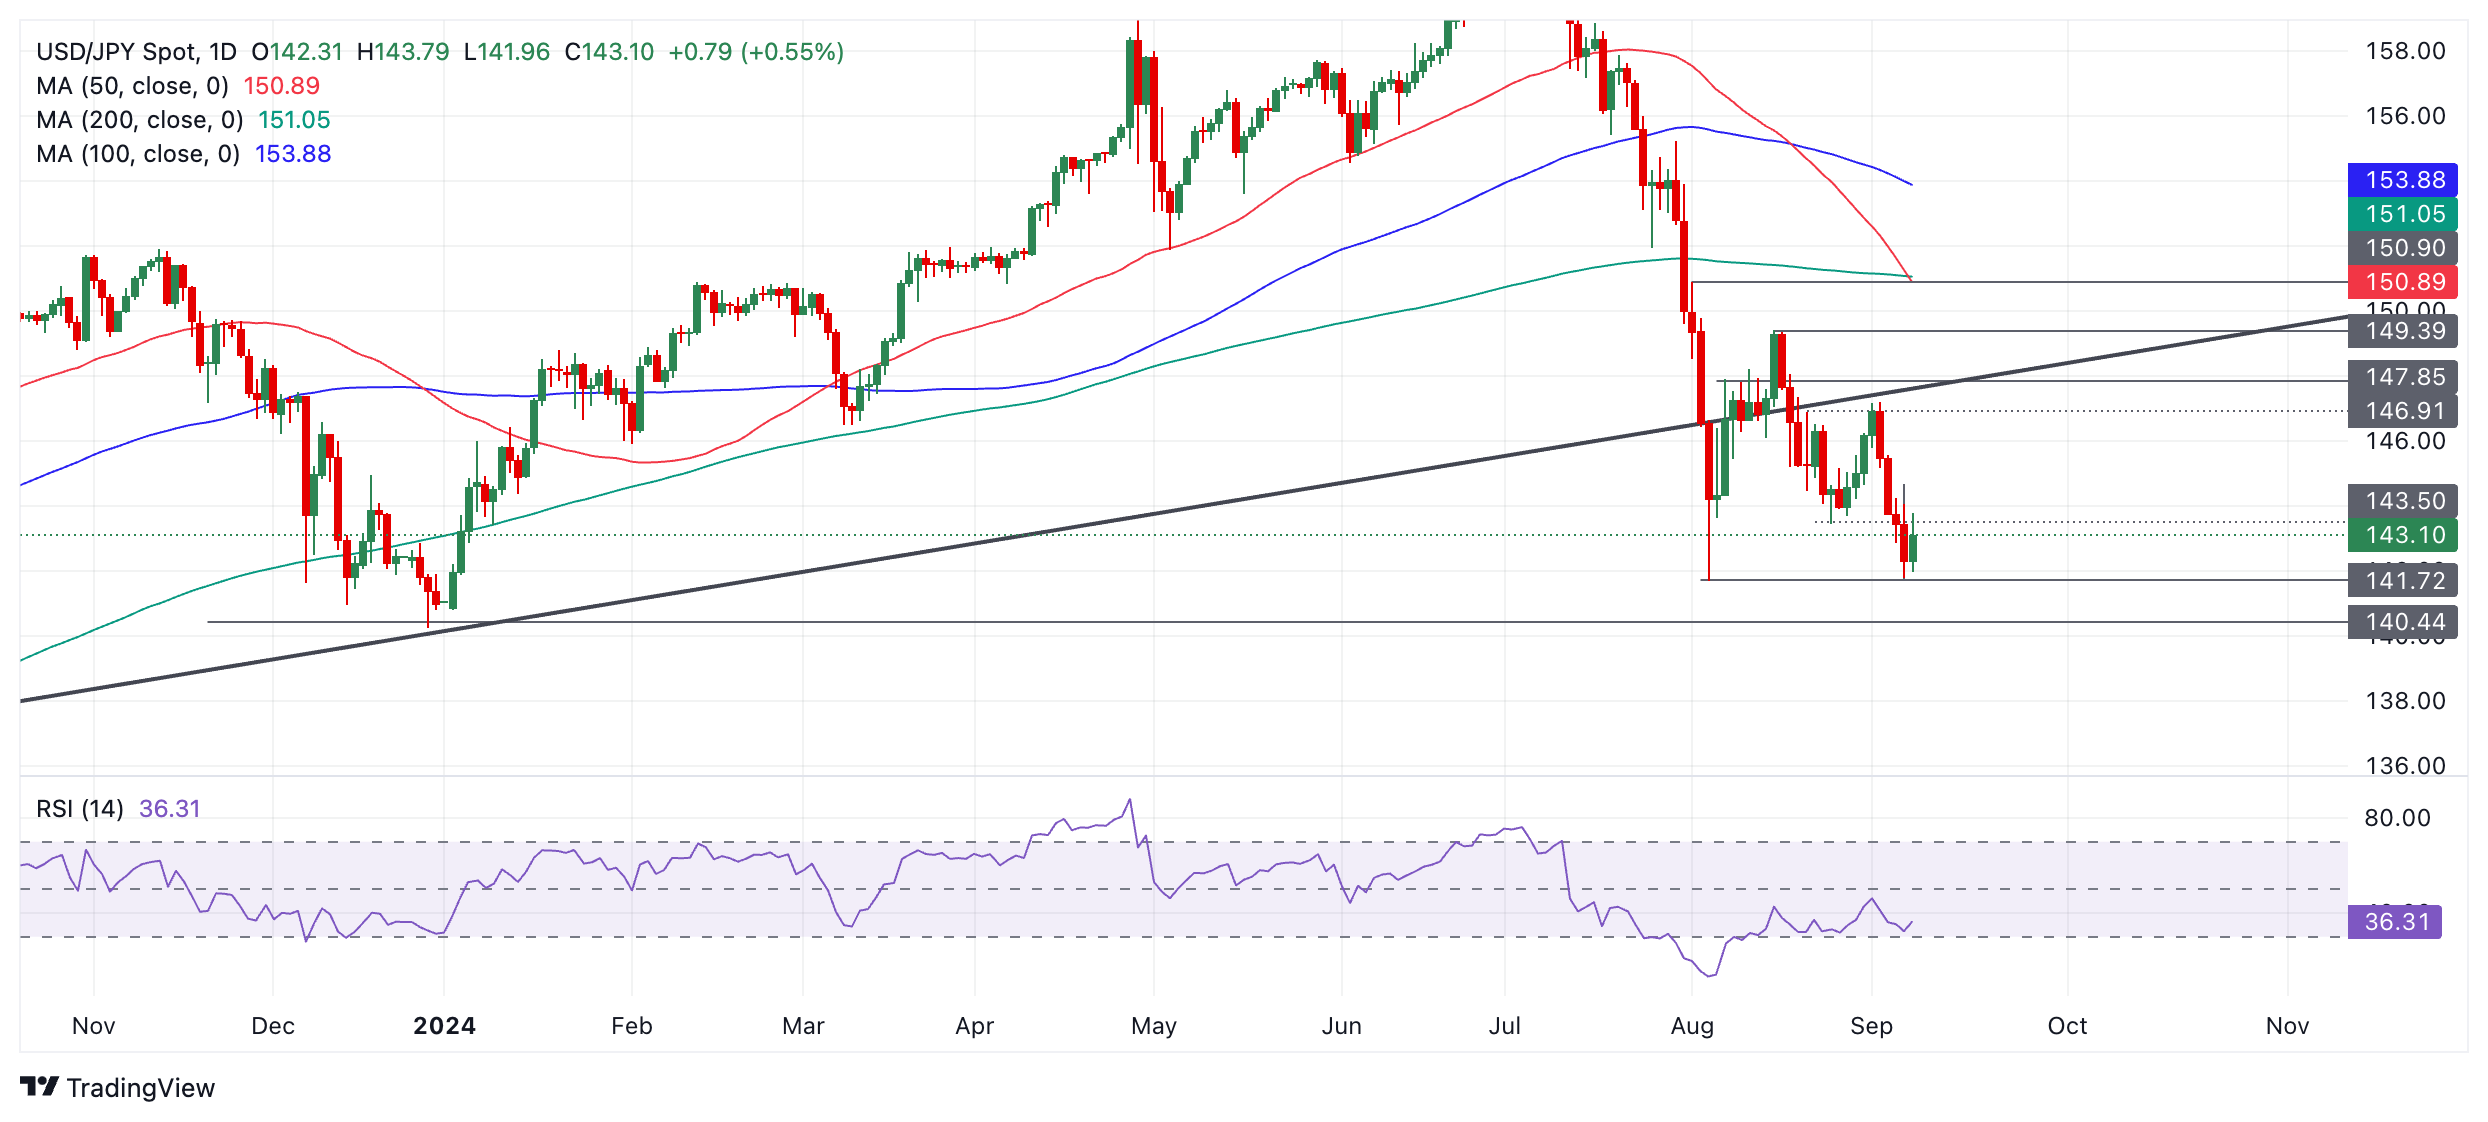
The pair has already broken below a major multi-year trendline, suggesting the long-term uptrend has been undermined. However, to confirm a reversal, price would have to break and close (on a daily or preferably weekly basis) below the August 5 low at 141.69. 

Strong support comes in at 140.25 (December 2023 low) and this could slow the pair’s descent. A break below that level too, would provide even more confirmatory evidence of a reversal in the trend. 

Given it is a principle of technical analysis theory that “the trend is your friend” , establishing the direction of the trend helps forecast where price is most likely to go next, so such a breakdown would increase the odds of more downside evolving in the future.


Disclaimer: For information purposes only. Past performance is not indicative of future results.
placeholder
Seesaw Effect Continues. US Pre-Market Three Major Index Futures Weaken, Oil Prices Rise, Bitcoin Drops Below 68,000 MarkAgainst a backdrop of intertwined geopolitical risks and macroeconomic uncertainty, global market sentiment has repeatedly diverged. In Friday pre-market trading ET, the three major U.S.
Author  TradingKey
8 hours ago
Against a backdrop of intertwined geopolitical risks and macroeconomic uncertainty, global market sentiment has repeatedly diverged. In Friday pre-market trading ET, the three major U.S.
placeholder
Australian Dollar falls to two-month lows on US–Iran peace uncertaintyAUD/USD extends its losing streak for the fourth consecutive day, trading around 0.6880 during the Asian hours on Friday.
Author  FXStreet
17 hours ago
AUD/USD extends its losing streak for the fourth consecutive day, trading around 0.6880 during the Asian hours on Friday.
placeholder
US-Iran Rift Persists, Will Gold Rise or Fall Next?US-Iran tensions persist; $4,400 becomes the gold ( XAUUSD) bulls' make-or-break level.During the European session on March 26, as of press time, spot gold retreated 1.5% to $4,436.42 per
Author  TradingKey
Yesterday 10: 21
US-Iran tensions persist; $4,400 becomes the gold ( XAUUSD) bulls' make-or-break level.During the European session on March 26, as of press time, spot gold retreated 1.5% to $4,436.42 per
placeholder
Gold rallies on hopes for US-Iran talks and falling US Treasury yieldsGold price (XAU/USD) gains nearly 2% on Wednesday as Oil futures prices tumbled amid growing speculation that the US and Iran would begin talks to end the conflict that started nearly four weeks ago. At the time of writing, XAU/USD trades at $4,556.
Author  FXStreet
Yesterday 01: 33
Gold price (XAU/USD) gains nearly 2% on Wednesday as Oil futures prices tumbled amid growing speculation that the US and Iran would begin talks to end the conflict that started nearly four weeks ago. At the time of writing, XAU/USD trades at $4,556.
placeholder
Gold Prices Under Pressure After Hitting $4,600, UBS: Safe-Haven Logic Unchanged But Only Delayed.Impacted by signs of easing geopolitical risks in the Middle East, international gold prices (XAUUSD) rebounded sharply after previously falling to the $4,100 level, at one point climbing
Author  TradingKey
Mar 25, Wed
Impacted by signs of easing geopolitical risks in the Middle East, international gold prices (XAUUSD) rebounded sharply after previously falling to the $4,100 level, at one point climbing
Related Instrument
goTop
quote