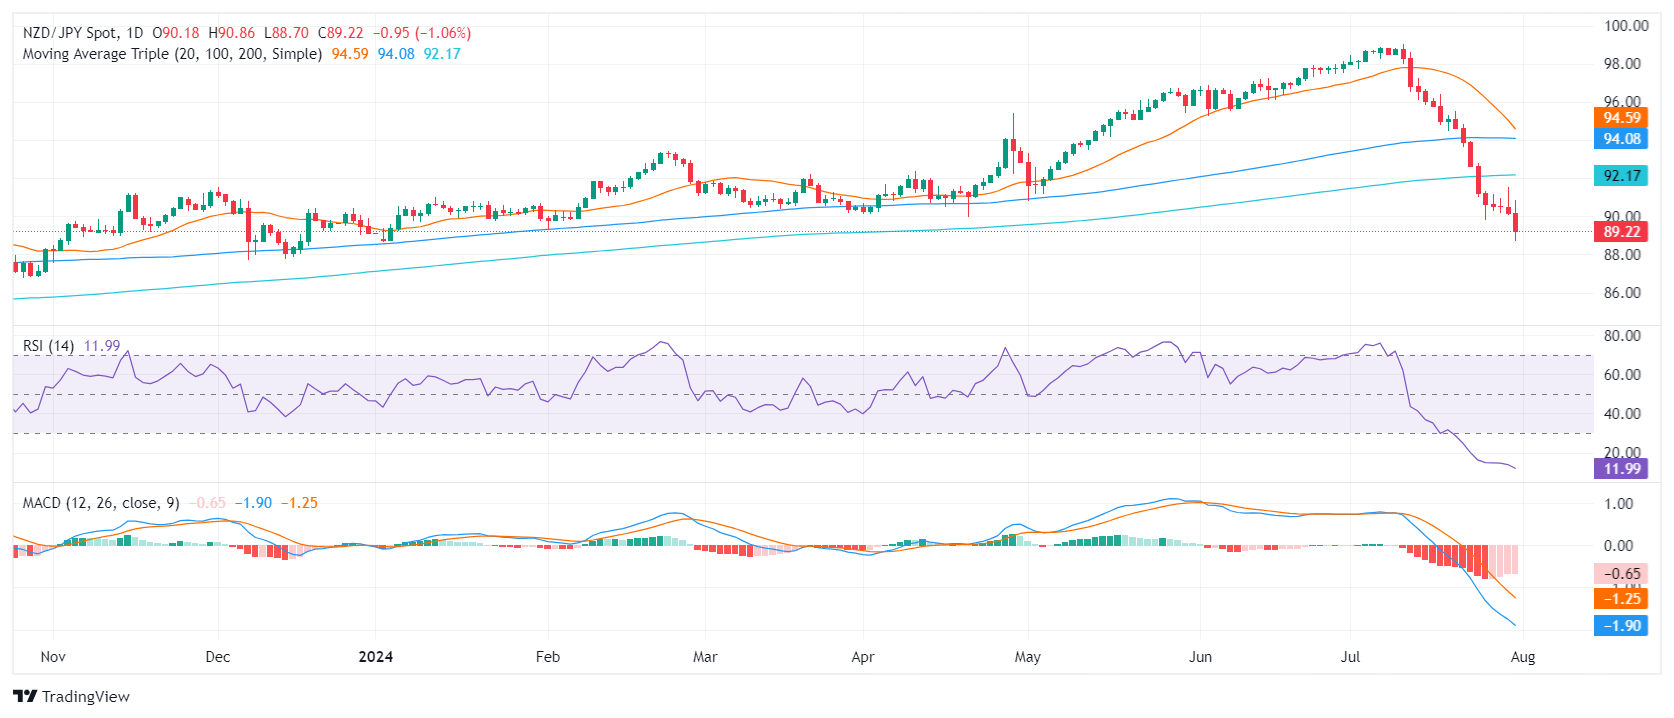
NZD/JPY Price Analysis: Pair declines to lows since early January, 90.00 support gone

Source Fxstreet
  • NZD/JPY sharply declined below 90.
  • Resistance is seen at 90.50, while key support is at 88.70.
  • RSI indicates oversold conditions, and MACD shows persistent bearish momentum.

In Wednesday's session, the NZD/JPY declined by more than 1% to 89.20, its lowest level since January. This drop reflects increased selling pressure as the pair continues to struggle below key resistance levels.

The pair encountered resistance at 90.50, a level it has failed to breach in recent sessions. If the downward trend continues, immediate support is expected around 88.70, a crucial level to watch for any potential rebounds. Technical indicators suggest a bearish outlook. The Relative Strength Index (RSI), currently at 15, signals oversold conditions, hinting at possible corrective bounces. However, the Moving Average Convergence Divergence (MACD)  flat red bars indicate ongoing bearish momentum. Volume trends reinforce this sentiment, suggesting sustained selling pressure without significant buying interest to counteract it.

However, the deep oversold conditions of the RSI might prompt an upward correction.

NZD/JPY daily chart

Disclaimer: For information purposes only. Past performance is not indicative of future results.
placeholder
Crypto Weekly Radar: All eyes on Donald Trump’s ultimatum, US macroeconomic dataCrypto markets begin the week with mixed sentiment, with Bitcoin (BTC) trading above $69,000 following last week’s rebound. Still, markets remain cautious as traders weigh risks stemming from Donald Trump’s renewed threats toward Iran ahead of the ultimatum set for Tuesday.
Author  FXStreet
7 hours ago
Crypto markets begin the week with mixed sentiment, with Bitcoin (BTC) trading above $69,000 following last week’s rebound. Still, markets remain cautious as traders weigh risks stemming from Donald Trump’s renewed threats toward Iran ahead of the ultimatum set for Tuesday.
placeholder
WTI eases below $103.50 as US, Iran reportedly seeking 45-day ceasefireWest Texas Intermediate (WTI), the US crude oil benchmark, is trading around $103.30 during the early European trading hours on Monday. The WTI price retreats after reports that the United States (US) and Iran are making a push for a 45-day ceasefire. 
Author  FXStreet
7 hours ago
West Texas Intermediate (WTI), the US crude oil benchmark, is trading around $103.30 during the early European trading hours on Monday. The WTI price retreats after reports that the United States (US) and Iran are making a push for a 45-day ceasefire. 
placeholder
Gold under pressure as fears mount, $4,600 support at risk Spot Gold gapped marginally lower at the weekly opening, with the XAU/USD pair battling to retain the $4,600 mark early in the Asian session.
Author  TradingKey
15 hours ago
Spot Gold gapped marginally lower at the weekly opening, with the XAU/USD pair battling to retain the $4,600 mark early in the Asian session.
placeholder
Gold Second-Quarter Outlook: Safe-Haven Failure or Pricing Logic Reshaping? Can Gold Enter a Major Rally?In the first quarter of 2026, gold prices experienced a classic "roller-coaster" ride. Against a macroeconomic backdrop of escalating geopolitical conflicts, gold prices briefly broke thr
Author  TradingKey
Apr 03, Fri
In the first quarter of 2026, gold prices experienced a classic "roller-coaster" ride. Against a macroeconomic backdrop of escalating geopolitical conflicts, gold prices briefly broke thr
placeholder
Spot Crude Oil Breaks $140. First Time Since 2008. Oil Market’s Most Severe Shock in History Is Here. On Thursday, April 2, Dated Brent crude prices reached $141.37 per barrel, the highest level since 2008, surpassing the peak set during the outbreak of the Russia-Ukraine conflict in 2022
Author  TradingKey
Apr 03, Fri
On Thursday, April 2, Dated Brent crude prices reached $141.37 per barrel, the highest level since 2008, surpassing the peak set during the outbreak of the Russia-Ukraine conflict in 2022
Related Instrument
goTop
quote