

GBP/USD settles back below 1.30 as Greenback selling abates
- GBP/USD clipped back beneath 1.3000 handle on Thursday.
- Broad-market US Dollar selling is taking a breather.
- UK Retail Sales to wrap up the GBP’s trading week.
GBP/USD has settled back below the 1.3000 key level on Thursday as Greenback short pressures eases. Investors are taking a breather after a hard rally through the early trading week as market sentiment surged on Federal Reserve (Fed) rate cut expectations getting pinned to the ceiling.
Forex Today: Investors’ attention now looks at Fedspeak
UK data came in mostly as expected on Thursday, with a slightly better-than-expected but still lower print in unemployment claims. Meanwhile, US Initial Jobless Claims rose as rate-cut-hungry markets got further signs of a slowdown that will help bully the Fed into rate cuts beginning in September.
GBP traders will wrap up a hectic but overall unremarkable UK data docket this week with Friday’s UK Retail Sales for the month of June. MoM Retail Sales are forecast to contract by 0.4% after the previous month’s 2.9% surge, while annualized Retail Sales are expected to slow sharply to 0.2% versus the previous 1.3%.
US Initial Jobless Claims increased more than expected on Thursday, adding 243K new unemployment benefits seekers for the week ended July 12 compared to the expected 230K, and rising above the previous week’s revised 223K. With labor data softening, market expectations of a September rate cut will be further bolstered, but bets for a Fed rate trim have nowhere left to go with markets already pricing in nearly 100% odds of a quarter-point rate cut from the Federal Open Market Committee (FOMC) on September 18.
On the UK side, Average Earnings printed broadly as expected, while June’s Claimant Count Change eased to 32.3K from the previous revised 51.9K, however the figure failed to reach the modeled forecast of 23.4K.
British Pound PRICE This week
The table below shows the percentage change of British Pound (GBP) against listed major currencies this week. British Pound was the strongest against the New Zealand Dollar.
| USD | EUR | GBP | JPY | CAD | AUD | NZD | CHF | |
|---|---|---|---|---|---|---|---|---|
| USD | 0.07% | 0.32% | -0.55% | 0.43% | 1.16% | 1.06% | -0.75% | |
| EUR | -0.07% | 0.29% | -0.43% | 0.55% | 1.12% | 1.18% | -0.64% | |
| GBP | -0.32% | -0.29% | -0.61% | 0.26% | 0.82% | 0.84% | -0.92% | |
| JPY | 0.55% | 0.43% | 0.61% | 0.98% | 1.49% | 1.57% | -0.39% | |
| CAD | -0.43% | -0.55% | -0.26% | -0.98% | 0.65% | 0.62% | -1.19% | |
| AUD | -1.16% | -1.12% | -0.82% | -1.49% | -0.65% | 0.06% | -1.73% | |
| NZD | -1.06% | -1.18% | -0.84% | -1.57% | -0.62% | -0.06% | -1.80% | |
| CHF | 0.75% | 0.64% | 0.92% | 0.39% | 1.19% | 1.73% | 1.80% |
The heat map shows percentage changes of major currencies against each other. The base currency is picked from the left column, while the quote currency is picked from the top row. For example, if you pick the British Pound from the left column and move along the horizontal line to the US Dollar, the percentage change displayed in the box will represent GBP (base)/USD (quote).
GBP/USD technical outlook
GBP/USD recently set a 12-month high of 1.3044, but topside momentum drained out of the Cable and the pair is falling back to the 200-hour Exponential Moving Average (EMA) at 1.2922. An extended backslide will see short pressure building to force the pair back down to the 200-day EMA at 1.2621, but with price action trading well above the long-run moving average, a bullish recovery from 1.2800 isn’t off the table as the 50-day EMA rising into 1.2754.
GBP/USD hourly chart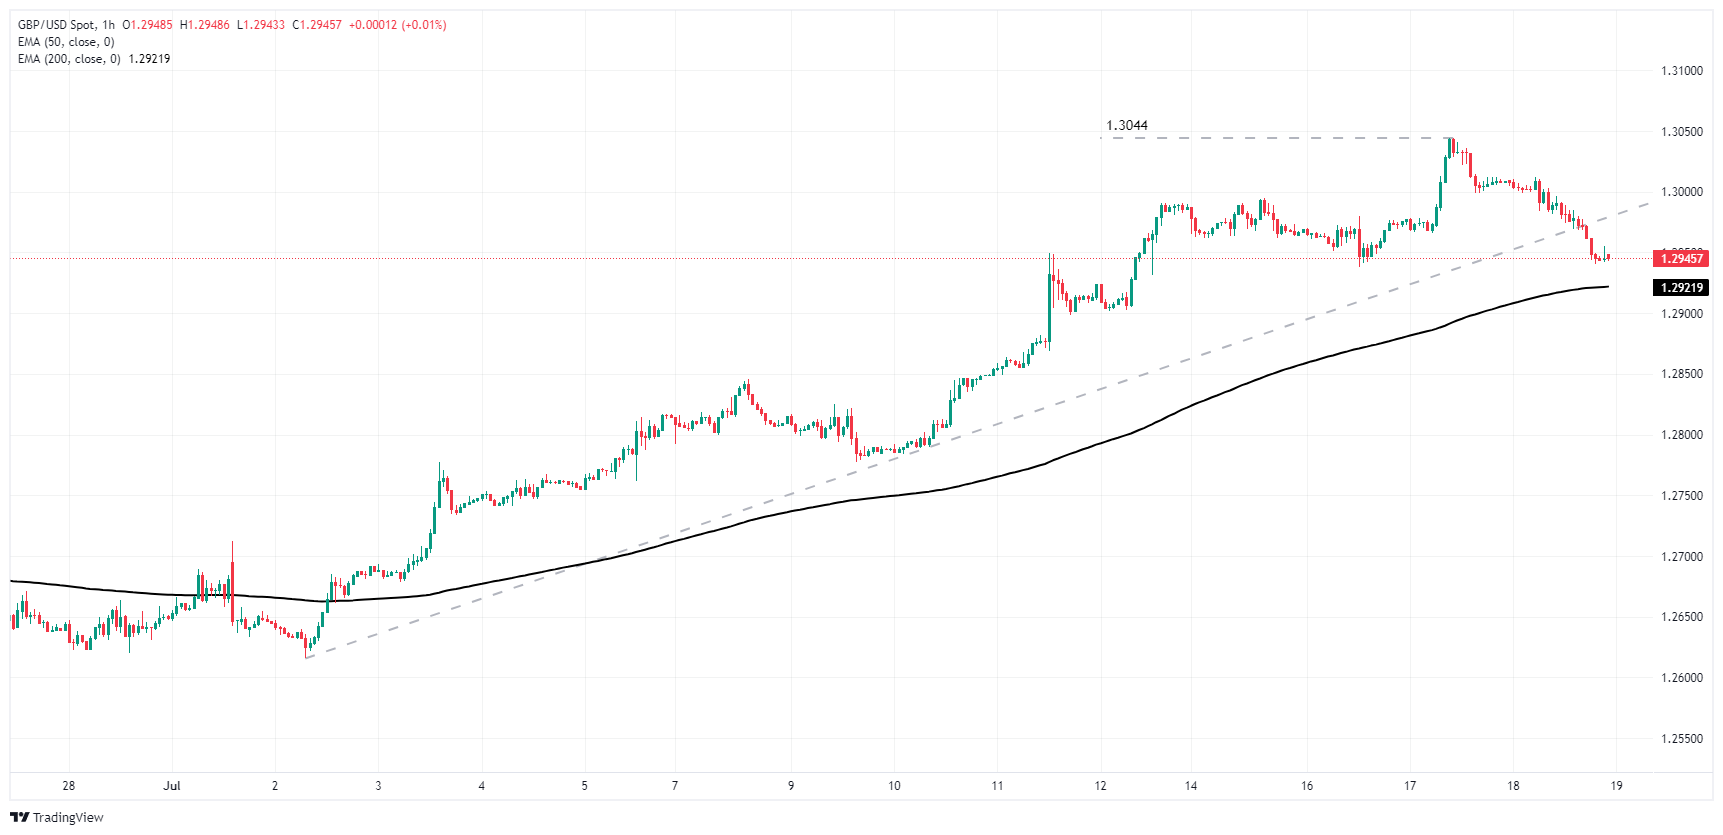
GBP/USD daily chart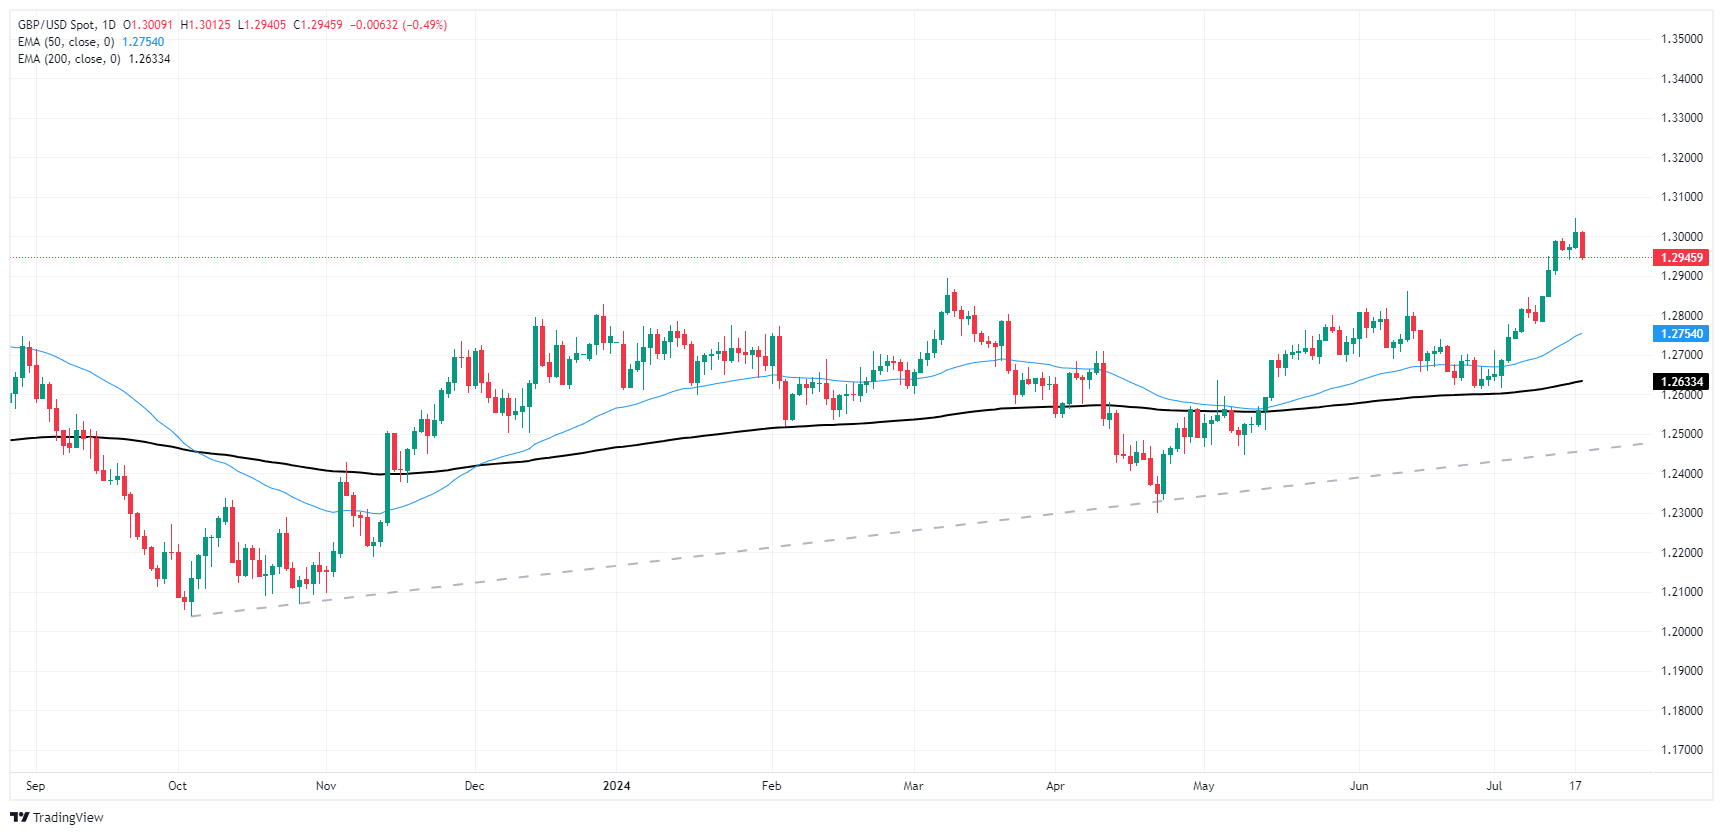
Pound Sterling FAQs
The Pound Sterling (GBP) is the oldest currency in the world (886 AD) and the official currency of the United Kingdom. It is the fourth most traded unit for foreign exchange (FX) in the world, accounting for 12% of all transactions, averaging $630 billion a day, according to 2022 data. Its key trading pairs are GBP/USD, aka ‘Cable’, which accounts for 11% of FX, GBP/JPY, or the ‘Dragon’ as it is known by traders (3%), and EUR/GBP (2%). The Pound Sterling is issued by the Bank of England (BoE).
The single most important factor influencing the value of the Pound Sterling is monetary policy decided by the Bank of England. The BoE bases its decisions on whether it has achieved its primary goal of “price stability” – a steady inflation rate of around 2%. Its primary tool for achieving this is the adjustment of interest rates. When inflation is too high, the BoE will try to rein it in by raising interest rates, making it more expensive for people and businesses to access credit. This is generally positive for GBP, as higher interest rates make the UK a more attractive place for global investors to park their money. When inflation falls too low it is a sign economic growth is slowing. In this scenario, the BoE will consider lowering interest rates to cheapen credit so businesses will borrow more to invest in growth-generating projects.
Data releases gauge the health of the economy and can impact the value of the Pound Sterling. Indicators such as GDP, Manufacturing and Services PMIs, and employment can all influence the direction of the GBP. A strong economy is good for Sterling. Not only does it attract more foreign investment but it may encourage the BoE to put up interest rates, which will directly strengthen GBP. Otherwise, if economic data is weak, the Pound Sterling is likely to fall.
Another significant data release for the Pound Sterling is the Trade Balance. This indicator measures the difference between what a country earns from its exports and what it spends on imports over a given period. If a country produces highly sought-after exports, its currency will benefit purely from the extra demand created from foreign buyers seeking to purchase these goods. Therefore, a positive net Trade Balance strengthens a currency and vice versa for a negative balance.
Recommended Articles


