NZD/JPY Price Analysis: Pair rebounds as sellers take a breather

Source Fxstreet
  • Thursday's session witnessed the NZD/JPY pair rebounding, counterbalancing part of the bearish momentum.
  • Despite the small rise, the cross still registers a weekly loss of 1.50%.
  • Though corrective actions take place, technical indicators still depict a negative outlook.

In Thursday's session, the NZD/JPY pair managed to record a slight upsurge and landed at 95.15. Despite this rebounding action, the pair accumulated approximately 1.50% losses over the week, indicating a persistently negative outlook.

Day-to-day technical indicators extend the domination of the bears, despite the recent rebound. The Relative Strength Index (RSI), currently positioned at 33, indicates a northward momentum, an uplift from Wednesday's value of 28. However, it's still well within negative zone but has now scaped the oversold threshold. The Moving Average Convergence Divergence (MACD) continues to print flat red bars, demonstrating sustained but now halted selling pressure.

NZD/JPY daily chart

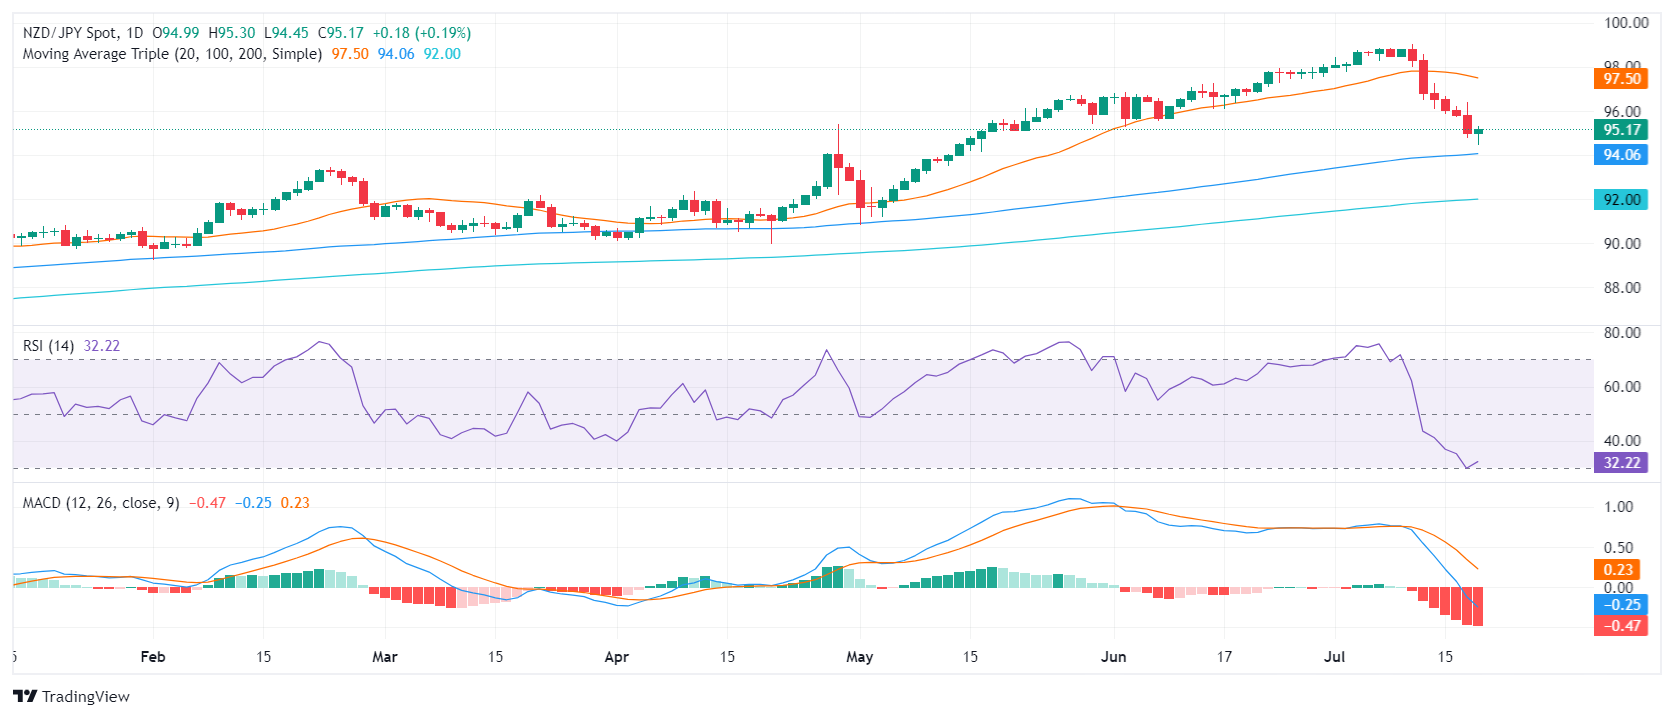
Reflective of the prevailing bearish tone, immediate support levels are now spotted lower at 94.50 and the crucial level at 94.00. A descent below these levels could confirm the bearish dominance over the short term. Resistances, on the other hand, are now at the previous support levels of 95.50, and 96.00.

Disclaimer: For information purposes only. Past performance is not indicative of future results.
placeholder
Why a Quiet 2025 Signals a Massive 2026 Crypto Bull Run: Bitwise CIO ExplainsBitwise's Matt Hougan Predicts a Crypto Boom in 2026 Amid Current Market Struggles
Author  Mitrade
Nov 13, Thu
Bitwise's Matt Hougan Predicts a Crypto Boom in 2026 Amid Current Market Struggles
placeholder
Bitcoin vs. Ethereum: Distinct Monetary UniversesBitcoin and Ethereum are diverging significantly in their monetary roles, according to a joint report from Glassnode and Keyrock.
Author  Mitrade
Nov 14, Fri
Bitcoin and Ethereum are diverging significantly in their monetary roles, according to a joint report from Glassnode and Keyrock.
placeholder
Ethereum slides 5% as bears lean on $3,500 cap and put $3,150 support in focusEthereum (ETH) drops more than 5% after a failed push above $3,550, with price sliding to $3,153 and now holding below $3,350, the 100-hour SMA and a bearish trend line at $3,500; unless bulls reclaim the $3,350–$3,500 zone, the short-term bias stays bearish and a clean break under $3,150 could expose $3,050, $3,000 and even the $2,880–$2,850 support area.
Author  Mitrade
Nov 14, Fri
Ethereum (ETH) drops more than 5% after a failed push above $3,550, with price sliding to $3,153 and now holding below $3,350, the 100-hour SMA and a bearish trend line at $3,500; unless bulls reclaim the $3,350–$3,500 zone, the short-term bias stays bearish and a clean break under $3,150 could expose $3,050, $3,000 and even the $2,880–$2,850 support area.
placeholder
Gold Posts Biggest Weekly Gain in a Month as US Data Delays Fuel UncertaintyGold climbed higher on Friday, marking its strongest weekly performance in a month, as traders weighed the impact of a data backlog following the end of the US government's extended shutdown. Silver also moved upward.
Author  Mitrade
Nov 14, Fri
Gold climbed higher on Friday, marking its strongest weekly performance in a month, as traders weighed the impact of a data backlog following the end of the US government's extended shutdown. Silver also moved upward.
placeholder
Top 3 Price Prediction: Bitcoin, Ethereum, Ripple – BTC, ETH, and XRP flash deeper downside risks as market selloff intensifiesBitcoin (BTC), Ethereum (ETH) and Ripple (XRP) trade in red on Friday after correcting more than 5%, 10% and 2%, respectively, so far this week.
Author  FXStreet
Nov 14, Fri
Bitcoin (BTC), Ethereum (ETH) and Ripple (XRP) trade in red on Friday after correcting more than 5%, 10% and 2%, respectively, so far this week.
Related Instrument
goTop
quote