NZD/USD Price Analysis: Pairs regains ground, future depends on the 20-day SMA resistance hold

Source Fxstreet
  • NZD/USD gains momentum resuming back above the 20-day SMA.
  • Bulls attempt to maintain control after Thursday's recovery transitioned the technical outlook towards a slightly bullish sentiment.

On Friday's session, the NZD/USD demonstrated renewed strength after recovering from a period of decline, resulting in a rise to around 0.6120.

Daily technical indicators present a cautiously optimistic picture. The Relative Strength Index (RSI) currently stands at 52 in positive territory. This rise signifies a strengthening bullish momentum, however, the market is still far from confirming a positive outlook. The Moving Average Convergence Divergence (MACD) prints decreasing red bars, indicative of slowing bearish momentum.

NZD/USD daily chart

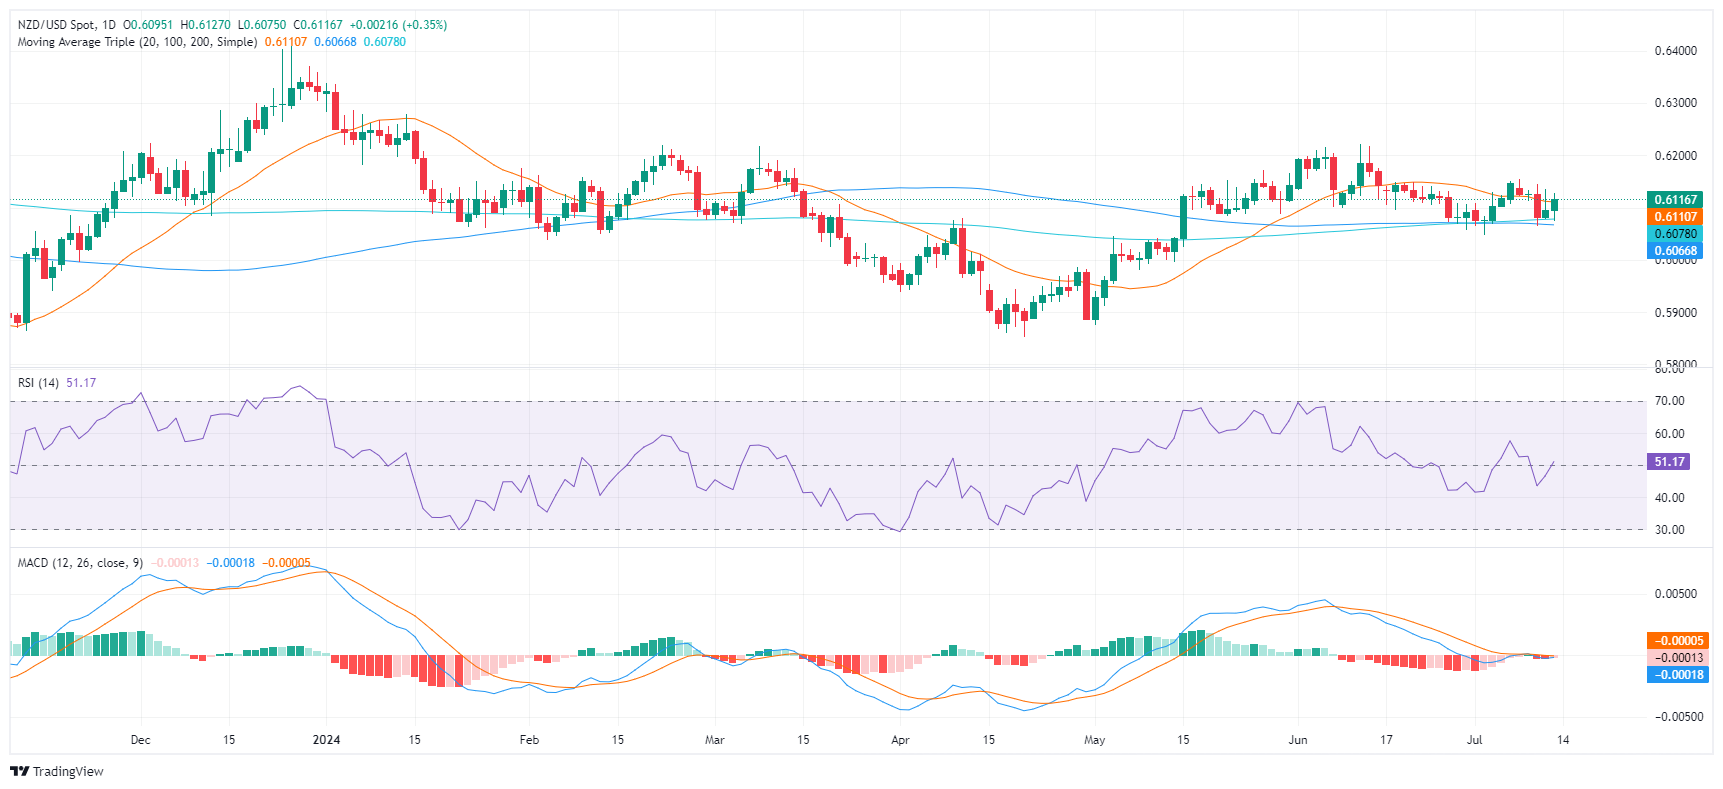
On the upside, bulls will face a challenge at 0.6150 and 0.6200. Achieving a decisive close above these levels would signal a further establishment of control towards the bulls.

Downward, the first line of defense lies at the convergence of the 100 and 200-day SMAs at 0.6070. A bearish turn below this level would incline the outlook back to the bearish side, potentially triggering a corrective slide towards 0.6050 and then to the 0.6030 support levels.

Disclaimer: For information purposes only. Past performance is not indicative of future results.
placeholder
What's Really Inside the AI Bubble? Decoding the Core Controversies Over Scale, Reliance and Valuation As ChatGPT nears its three-year anniversary, the AI boom has fueled a three-year U.S. equity rally. However, growing AI bubble concerns and investor fatigue now threaten to derail market
Author  TradingKey
Yesterday 10: 11
As ChatGPT nears its three-year anniversary, the AI boom has fueled a three-year U.S. equity rally. However, growing AI bubble concerns and investor fatigue now threaten to derail market
placeholder
Top 3 Price Prediction: Bitcoin, Ethereum, Ripple – BTC, ETH, and XRP flash deeper downside risks as market selloff intensifiesBitcoin (BTC), Ethereum (ETH) and Ripple (XRP) trade in red on Friday after correcting more than 5%, 10% and 2%, respectively, so far this week.
Author  FXStreet
Yesterday 08: 32
Bitcoin (BTC), Ethereum (ETH) and Ripple (XRP) trade in red on Friday after correcting more than 5%, 10% and 2%, respectively, so far this week.
placeholder
Gold Posts Biggest Weekly Gain in a Month as US Data Delays Fuel UncertaintyGold climbed higher on Friday, marking its strongest weekly performance in a month, as traders weighed the impact of a data backlog following the end of the US government's extended shutdown. Silver also moved upward.
Author  Mitrade
Yesterday 05: 48
Gold climbed higher on Friday, marking its strongest weekly performance in a month, as traders weighed the impact of a data backlog following the end of the US government's extended shutdown. Silver also moved upward.
placeholder
WTI rises to near $60.00 on supply risks due to US sanctionsWest Texas Intermediate (WTI) Oil price gains for the second successive session, trading around $59.90, up by more than 2%, during the Asian hours on Friday. Crude Oil prices receive support from supply risks linked to upcoming United States (US) sanctions.
Author  FXStreet
Yesterday 03: 47
West Texas Intermediate (WTI) Oil price gains for the second successive session, trading around $59.90, up by more than 2%, during the Asian hours on Friday. Crude Oil prices receive support from supply risks linked to upcoming United States (US) sanctions.
placeholder
Ethereum slides 5% as bears lean on $3,500 cap and put $3,150 support in focusEthereum (ETH) drops more than 5% after a failed push above $3,550, with price sliding to $3,153 and now holding below $3,350, the 100-hour SMA and a bearish trend line at $3,500; unless bulls reclaim the $3,350–$3,500 zone, the short-term bias stays bearish and a clean break under $3,150 could expose $3,050, $3,000 and even the $2,880–$2,850 support area.
Author  Mitrade
Yesterday 03: 41
Ethereum (ETH) drops more than 5% after a failed push above $3,550, with price sliding to $3,153 and now holding below $3,350, the 100-hour SMA and a bearish trend line at $3,500; unless bulls reclaim the $3,350–$3,500 zone, the short-term bias stays bearish and a clean break under $3,150 could expose $3,050, $3,000 and even the $2,880–$2,850 support area.
Related Instrument
goTop
quote